
James Amoo, Community Partner
May 26, 2026

You inherit a messy Excel sheet from a coworker who left, a vendor who delivered a "report," or a predecessor who built the workbook three reorganizations ago. You open it. There are seven tabs, color-coded rows that may or may not mean something, a column where dates are sometimes text and sometimes numbers, and at least one cell labeled “FINAL_v3_use_this." Your instinct is to start the data cleaning process.
That instinct is usually why cleanup fails. Most people start scrubbing messy Excel data before they understand what the workbook is actually doing. They fix what looks wrong rather than what is wrong, which means the same problems show up again next month, often in slightly different forms.
This article takes a different approach: diagnose first, clean second. Before you reformat a single cell, you need a reliable way to identify what is broken structurally, what is broken at the data level, and what is broken in the formulas. Once you know that, cleanup becomes a deliberate set of decisions instead of a guessing game.
Diagnosing symptoms and root causes
A symptom is what looks wrong on the surface: misaligned columns, weird totals, "#REF!" errors, dates that sort incorrectly. A root cause is the underlying reason a symptom exists. This includes a column with mixed data types, a formula that references a deleted range, or a layout that crams three tables into one sheet. Cleaning symptoms feel productive but rarely stick. Cleaning root causes is harder up front and far more durable.
To diagnose root causes, work through three layers that separate governance, process, and product-level issues before any remediation begins:
- Structural problems: how the workbook is organized.
- Data-quality problems: what is in the cells.
- Formula and logic problems: how values are computed.
Within each layer, separate structural problems (things that break analysis) from cosmetic problems (things that just look bad). A merged title cell at the top of a report is cosmetic. A merged header row inside your data table is structural. Knowing the difference is what tells you whether to patch the sheet or rebuild it from scratch, which is the decision the rest of this guide is built around.
Step 1: Diagnose structural problems first
Structure is the foundation. If the layout is wrong, no amount of formatting cleanup will save the workbook.
Multiple tables crammed into one sheet
Look for side-by-side tables, stacked tables separated by blank rows, or summary blocks sitting on top of raw data. Spreadsheets that grew organically often look like dashboards, with totals, charts, and source data all sharing one tab, which is a common mistake when building Excel dashboards.
This breaks downstream work. Pivot tables expect a single contiguous range. Lookups expect predictable column positions. Any automation that assumes "data starts at row 2" will fail the moment it hits a summary block. If you see more than one logical table on a single sheet, that is a structural problem.
Multi-tab sprawl and messy linked Excel sheets
Many workbooks split a single dataset across tabs by month, region, or owner. The data should be one normalized table with a column for the dimension. Instead, it lives in twelve sheets that all reference each other.
Messy Excel sheets and stale data are dangerous because the dependencies are invisible. Rename a tab, insert a row, or delete a column on one sheet, and a formula three tabs away silently breaks or quietly returns the wrong number. Before you clean anything, map the cross-sheet references. If you cannot draw the dependency graph in your head, the workbook needs structural work.
Poor or missing column labels
Headers are how machines understand your data. Watch for merged header cells, two- or three-row headers, blank header cells, and labels like "Amount2" or "Misc." Humans can guess what these mean. Formulas, pivot tables, and AI tools cannot.
A single, clear, one-row header is a non-negotiable prerequisite for the rest of the cleanup.
Hidden rows, columns, and filtered views
Filtered views and hidden columns are how previous owners tucked away data they did not want to look at. You cannot diagnose what you cannot see. Unhide everything and clear all filters before you continue. Treat any hidden range as suspicious until proven otherwise.
Step 2: Diagnose data-quality problems
Once the structure is mapped, look at what is actually inside the cells.
Mixed data types in a single column
This is the most common silent failure in messy Excel data. A "Date" column contains real dates, text strings like "Jan 5," and numbers stored as text. An "Amount" column has numbers, numbers formatted as text, and the occasional "TBD." A boolean column uses "Y," "yes," "TRUE," and 1 interchangeably.
Spreadsheets will happily display these together, and aggregations will quietly skip the values they cannot interpret. The result is totals that are off by a little, sorts that order things wrong, and lookups that fail without warning.
Null, blank, and placeholder values
There is a meaningful difference between an empty cell, a zero, "N/A," "-", "null," and "#N/A." Some mean "no data." Some mean "zero." Some mean "the formula failed." When these are mixed in a single column, aggregations corrupt: averages include zeros that should have been nulls, counts include placeholders, and sums skip text values you wanted included.
Document how each null-like value should be treated before you replace anything.
Inconsistent formatting
Color-coded rows. Bold text on totals. Yellow highlights on exceptions. Italics on estimates. This is semantic formatting, where visual style carries information that the underlying data does not..
It is invisible to formulas, pivot tables, AI tools, and anything else that reads cell values. If the only way to know which rows are "approved" is that they are green, that information will be lost the moment the data leaves the workbook. Semantic formatting needs to be promoted into a real column before cleanup.
Inconsistent text, date, and number formats
Casing differences ("acme corp," "Acme Corp," "ACME CORP."). Regional date formats mixed in one column ("3/4/2024" vs. "4/3/2024"). Currency symbols inside number cells. Decimal commas vs. decimal points. Phone numbers with and without dashes.
Standardization is the prerequisite for cleaning up messy data in Excel. Until casing, dates, numbers, and nulls are normalized, every downstream join, group-by, and lookup will produce slightly wrong answers. Most "the numbers don't match" problems in messy data in Excel trace back to this layer.
Step 3: Diagnose formula and logic problems
Formulas are where workbooks lie to you most convincingly, because the output looks like a number even when the logic is wrong.
Here are the key things to check:
- Inconsistent formulas across a column: This includes hardcoded rows or cells where the formula changes halfway down because someone "fixed" a few cells manually.
- Broken references: This includes "#REF!" errors, "#NAME?" errors, and lookups that point to ranges that no longer exist.
- Volatile functions: Functions like NOW(), TODAY(), INDIRECT(), and OFFSET() recalculate constantly and can mask reproducibility issues.
- External links: This includes references to other workbooks on someone's old laptop. These are the classic sources of messy linked Excel sheets that break the moment the file moves.
Formula inconsistency is usually the real reason a sheet "doesn't add up." A column that looks uniform can hide three different calculation methods, and the totals will reflect whichever method happens to land in the cells you are summing.
How Quadratic streamlines spreadsheet diagnosis and cleaning
An Excel assistant like Quadratic helps users slow down and diagnose the workbook systematically before making changes. Users can import an existing .xlsx file directly into the browser-based workspace and use AI to analyze the spreadsheet structure in context. Let’s explore the features of Quadratic in detail.
Connect spreadsheets to live operational data sources
A major reason spreadsheets become messy in the first place is that they rely on repeated manual imports and the need to merge Excel files. Teams constantly download CSVs, copy-paste reports, and overwrite previous versions, gradually introducing stale data into the workbook structure.
Quadratic reduces this fragmentation by allowing users to connect directly to databases, APIs, and external systems from inside the spreadsheet itself. Instead of manually refreshing exports, users can automate data processing and keep financial reporting workflows tied directly to live financial sources.
Rebuild fragile spreadsheet logic with Python and SQL
Many messy spreadsheets become difficult to maintain because the business logic itself has outgrown traditional formulas, prompting many to look for tools like pandas for Excel. Deeply nested IF statements, chained lookups, repeated calculations, and manual data transformations create workbooks that are hard to audit and nearly impossible to scale.
Quadratic allows users to modernize these workflows using native Python and SQL directly inside the spreadsheet environment. Instead of compressing operational logic into unreadable formulas, users seeking a Python alternative to Excel can rewrite transformations in structured Python workflows that are easier to understand, test, and maintain.
For example, users can use Python to normalize inconsistent datasets, automate categorization workflows, or rebuild reporting pipelines in a much more transparent format. SQL for data analysis can query and reshape large operational datasets directly inside the workbook without requiring external tools or exports.
Use AI to surface inconsistencies and hidden data-quality problems
Messy spreadsheets rarely fail because of one obvious error. The real problems usually come from subtle inconsistencies spread across hundreds or thousands of rows. This includes: mixed date formats, duplicated records, broken references, or manually overwritten calculations.
Quadratic uses AI spreadsheet analysis to identify these issues automatically inside the sheet itself. Users can ask the AI to flag columns with mixed data types, locate suspicious values, or explain where formulas diverge unexpectedly from surrounding calculations.
For example, Quadratic AI can identify where one row in a financial model contains a hardcoded number instead of a formula, where regional sales data uses inconsistent naming conventions, or where imported datasets contain hidden Excel formatting problems that break downstream reporting.
Let’s see how this works using a sample of dirty Excel data:
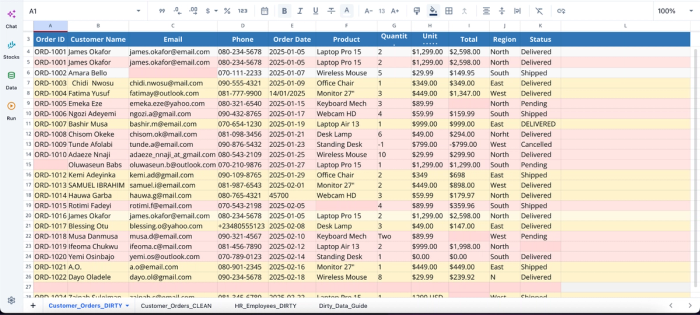
This dataset contains several inconsistencies, including duplicate rows, wrong date formats, and invalid data. With Quadratic, you do not need to write complex formulas or scripts to clean this data before visualization; all you need to do is ask using text prompts:
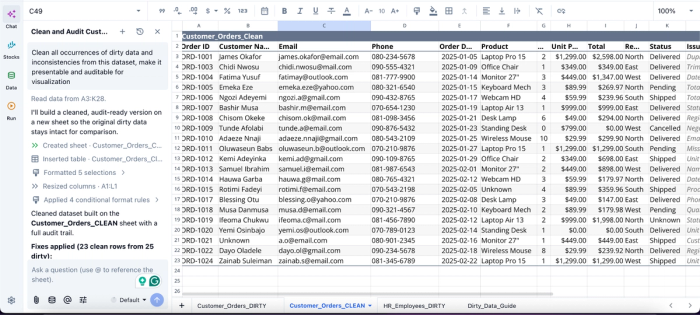
In this image demonstrating AI Excel analysis, I ask Quadratic AI to “Clean all occurrences of dirty data and inconsistencies from this dataset, make it presentable and auditable for visualization.” It creates a separate sheet that presents the cleaned dataset free from all dirty data. It also provides a fully transparent logic that allows users to audit the process behind the result.
Visualize structural issues before rebuilding the workflow
Spreadsheet problems are often easier to understand visually than cell by cell. A workbook with duplicate categories, missing values, or abnormal spikes may technically calculate without errors while still producing misleading outputs.
Quadratic allows users to build different charts and visual summaries directly on top of messy datasets during the diagnostic phase itself. Users can quickly visualize missing data distributions or validate whether cleanup efforts are improving the integrity of the dataset.
For example, a finance team cleaning an accounting dashboard could visualize unexplained expense spikes before and after normalization. An operations team tracking operational performance metrics could identify inconsistent regional reporting structures through dashboard summaries instead of manual inspection.
Here’s an example:
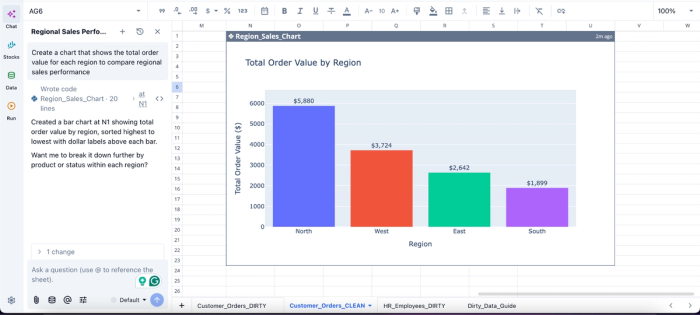
In this image, I ask Quadratic AI to “Create a chart that shows the total order value for each region to compare regional sales performance.” In seconds, it generates a bar chart that shows the total order value by region. From this chart, we can see that the North region has the highest order value with $5,880.
Keep the cleanup process collaborative and auditable
Spreadsheet cleanup is rarely a solo task. Finance teams, operations managers, analysts, and department leads often need to validate assumptions or review transformations together. Traditional spreadsheet workflows make this difficult because cleanup decisions happen across disconnected copies, email threads, and undocumented edits.
Quadratic supports real-time collaboration directly inside the workbook. Teams can review AI-generated diagnostics, inspect formulas, comment on transformation logic, validate cleanup decisions, and rebuild workflows together in the same collaborative analytics platform.
Conclusion
The reason most cleanup efforts fail is that they start in the wrong place. Diagnosis comes first. Work through the three layers (structural, data-quality, formula), separate structural problems from cosmetic ones, and use that to decide whether to patch or rebuild. Only then should you start changing cells.
That order is what separates a real fix from a cosmetic one, and it is what turns inherited chaos into something you can actually trust. With Quadratic, you can simply upload your messy Excel sheet, use AI to diagnose the root problems, then clean and restructure it into a reusable workflow. Try Quadratic for free.
Frequently asked questions (FAQs)
How does Quadratic help with diagnosing messy linked Excel sheets?
You can import a messy Excel spreadsheet directly into Quadratic and use its AI spreadsheet analysis to explain what the sheet does before you touch anything. It can identify the tables in the workbook, map dependencies across tabs (which is critical for messy linked Excel sheets), and call out suspicious values. The output is a diagnostic summary that prioritizes what to fix and in what order.
What should I do with semantic formatting like color-coded rows or bold text?
Semantic formatting is invisible to formulas, pivot tables, and AI tools. If the only way to know which rows are "approved" is that they're green, that information disappears when the data leaves the workbook. Before cleaning up messy data in Excel, promote semantic formatting into a real column so the meaning is stored in the data itself, not just in how it looks.
When should I rebuild a messy Excel sheet instead of just patching it?
Patch when issues are localized to a few columns, the underlying structure is sound, and you can fix everything in an hour or two. Rebuild when you have multi-tab sprawl with heavy cross-sheet references or when you're doing the same cleanup every month on a refreshed file. If you rebuild, don't just rebuild the spreadsheet. Use Quadratic to script the transformations as a reusable workflow so the next time fresh data arrives, the cleanup runs automatically.
