
James Amoo, Community Partner
Jun 1, 2026

Table of contents
- Why Excel users are reaching for pandas
- What pandas replaces in an Excel workflow
- The hidden cost: pandas strips away spreadsheet context
- Example workflows that feel native again
- A better model: pandas inside the spreadsheet using Quadratic
- Getting started with pandas for Excel users
- Frequently asked questions (FAQs)
If you have spent years living in spreadsheets, the pull toward pandas is real. Maybe a colleague keeps mentioning it, maybe you saw a tutorial, or maybe your latest workbook crashed under the weight of a few hundred thousand rows. pandas for Excel users is one of the most common bridges into Python and alternatives to VBA, and for good reason: the library handles the kinds of data cleaning, joining, and reshaping tasks that Excel can technically do but rarely does gracefully.
The catch is that most guides drop you into a notebook and assume you will be fine. For analysts trained on the visible logic of a spreadsheet, that environment quietly removes the very thing that made data work feel manageable. This article looks at what pandas actually replaces in an Excel workflow, why notebooks create a visibility gap for spreadsheet users, and how running pandas inside a spreadsheet closes it.
Why Excel users are reaching for pandas
Spreadsheets are excellent until they aren't. Most Excel users hit the same set of ceilings. This includes row counts that slow the file to a crawl, cleaning steps that need to be repeated every month, and pivot tables that break the moment a column name changes. Manual reconciliation between two exports, especially around month-end, can eat an entire afternoon.
As one of the best data analysis tools, pandas keeps coming up as the answer. It handles large datasets comfortably, makes cleaning logic repeatable, and joins data from many sources without much ceremony. For pandas for Excel users, the appeal is straightforward: do the same kinds of analysis you already do, but faster and at a larger scale.
The thesis of this article is also straightforward. Pandas itself is not the hard part. The notebooks and scripts most tutorials wrap around it are. They strip away the spreadsheet context that made Excel work for you in the first place, and that is what causes most spreadsheet users to bounce off pandas before they get the payoff.
That transition friction is where Quadratic becomes useful. Quadratic combines a familiar spreadsheet interface with native Python and SQL support, including pandas directly in the grid itself. Instead of abandoning the spreadsheet model entirely, users can work with pandas, SQL, formulas, AI-assisted analysis, and charts inside the same collaborative sheet.
What pandas replaces in an Excel workflow
Rather than walk through a full API, it helps to map common Excel jobs to the pandas concepts that take them on. Pandas' comparison with spreadsheets is a useful reference for this mapping. Using pandas for Excel work tends to shine in a few specific areas. Cleaning is one of the clearest examples. Standardizing text, fixing data types, removing stale data, and trimming whitespace become repeatable operations instead of a sequence of manual edits across rows and tabs. This is where data cleaning with pandas and NumPy consistently outpaces traditional spreadsheet work because the data transformation logic can be rerun on new data instead of being rebuilt every month.
Joining and reshaping data are other major reasons Excel users move toward pandas. When you connect spreadsheets in Excel, combining multiple files or sheets the way VLOOKUP or XLOOKUP would, but on arbitrary keys, multiple keys, and at a scale where formulas would slow the workbook to a stop, is one of pandas' strongest use cases. The pandas merge and join documentation covers the range of join types available, while the reshaping and pivot table tools handle grouping, pivoting, and unpivoting in ways that are much harder to maintain with formulas alone. Comparison workflows also become significantly easier. Diffing two files row by row is a recurring operational task. Pandas turns that into a few lines of code rather than a side-by-side manual review.
Charting is the final layer that makes the workflow practical. Once the data is cleaned and structured correctly, generating charts directly from a DataFrame answers the practical question of how to generate graph for Excel data using Python pandas without constantly exporting data back into Excel.
The hidden cost: pandas strips away spreadsheet context
Here is the part most "Excel to pandas" guides skip. In Excel, the data is always in front of you. You see every cell, every intermediate calculation, and every formula in the place where it lives. You can click a cell, trace its precedents, sort a column, or eyeball a range to spot something off. The grid is the working surface.
In a notebook, a DataFrame is a printout below a code cell, which is a very different experience from being able to code in Excel or a spreadsheet grid, where outputs are immediately visible. It is a snapshot, not a navigable surface. You cannot click into row 4,217 to see what happened. If you want to inspect an intermediate state, you have to add another print or another cell. Sorting and filtering require code, not a click.
For analysts trained on Excel, the consequences accumulate quickly. Spatial reasoning disappears because the data is no longer persistently visible in a grid. QA becomes harder because catching a stray null, a misaligned join, or an incorrect data type requires deliberate inspection rather than visual scanning. The muscle memory built around selecting ranges and comparing columns stops applying.
Example workflows that feel native again
A few short scenarios show what this looks like in practice. These are workflow sketches, not full code walkthroughs.
Cleaning and joining two messy exports. You load two CSVs or Excel files into the grid, write a few lines of pandas to standardize column names, fix types, and merge on a customer ID. The merged DataFrame appears as a real table in the grid. You scroll it, sort it, and spot the three rows where the join did not match. You fix the keys, rerun, and the table updates in place.
Comparing two Excel files for differences. A common task: this month's export against last month's. With pandas, a merge with an indicator column or a direct comparison produces a diff DataFrame. Rendered in the grid, the diff is a navigable table you can filter to "only changed rows" or "only new rows."
Generating a chart from cleaned Excel data. Once your data is clean, you can use pandas (or a Python visualization library on top of it) to produce a visualization placed beside the source table. The chart, the cleaned data, and the cleaning logic all sit in the same file. That is a direct answer to how to generate graph for Excel data using Python pandas without exporting anything.
A better model: pandas inside the spreadsheet using Quadratic
Quadratic is a browser-based spreadsheet that lets you write Python, including pandas, directly in spreadsheet cells. When your code returns a DataFrame, the output spills into the grid as inspectable cells. You can click into row 4,217. You can reference the resulting columns from formulas in neighboring cells. You can build a chart from the cleaned table without leaving the file. Let’s explore the features of Quadratic in detail.
Connect pandas directly to live business data
Traditional Excel workflows often revolve around exported snapshots. Teams download reports from databases, CRMs, or finance systems, clean them locally, and rebuild the same transformations every reporting cycle.
Quadratic changes that pattern by supporting direct connections to databases and APIs directly inside the spreadsheet. Pandas workflows can operate against connected datasets instead of static exports, which makes recurring analysis substantially more maintainable.
A growth analytics team, for example, could query customer acquisition data from Postgres, enrich it with API data from marketing platforms, transform it with pandas, and publish dashboard-ready metrics in the same spreadsheet. When the underlying data updates, the workflow reruns against fresh inputs instead of requiring another manual export cycle.
Clean messy Excel exports with pandas without losing visibility
One of the most common transitions from Excel to pandas happens during cleanup work. CSV exports with broken date formats or malformed numeric values quickly become painful to manage with formulas alone.
Quadratic makes that workflow substantially more transparent. A Python cell can load spreadsheet ranges into pandas, normalize column types, reshape tables, remove duplicates, and standardize values directly beside the original data. The cleaned result lands back into the grid immediately instead of disappearing into a notebook output or detached script.
An operations team reconciling weekly exports from multiple vendors can keep the raw import, the pandas transformation logic, the QA checks, and the final reporting table together in one shared spreadsheet. Anyone reviewing the file can trace how the data changed at every step instead of reverse-engineering a disconnected Python pipeline.
Use AI to accelerate pandas workflows directly in the sheet
Writing pandas transformations from scratch is powerful, but it can also slow down exploratory data analysis. Analysts often know the outcome they want without remembering the exact syntax needed to achieve it.
Quadratic integrates AI Excel analysis directly into the spreadsheet workflow so users can describe transformations in natural language and generate pandas code inline. Instead of copying prompts into an external chatbot and manually transferring the results back into the spreadsheet, the generated Python appears directly in cells where it can be executed and edited immediately.
An analyst could ask the AI to identify missing values, normalize inconsistent categories, pivot transactional data into a reporting table, or compare month-over-month trends across regions. The AI-generated logic stays attached to the sheet itself, turning the workflow into a reusable analytical model rather than a temporary conversation.
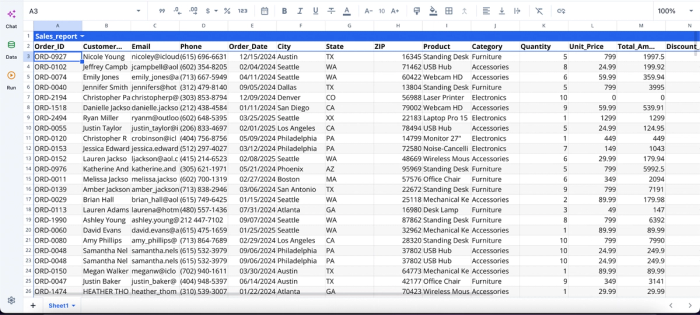
Let’s see how this works by importing dirty Excel data into Quadratic.:
After successfully importing our Excel data, we can immediately begin the cleaning and analysis process using Quadratic AI:
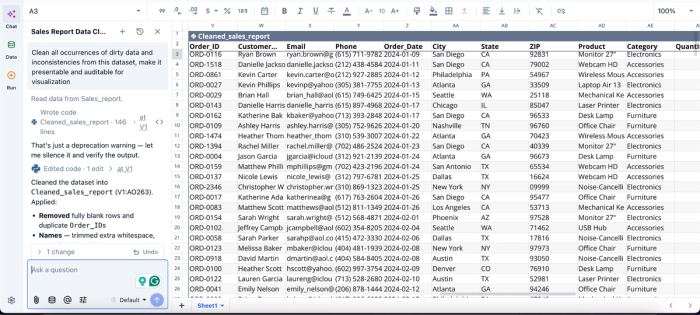
In this image, I ask Quadratic AI to “Clean all occurrences of dirty data and inconsistencies from this dataset, make it presentable and auditable for visualization.” It instantly creates a cleaned version of my dataset, fixing inconsistencies like duplicates, inconsistent formatting, and missing values.
Turn pandas outputs into spreadsheet-native dashboards
Visualization is often where notebook-based workflows become disconnected from business users. Charts generated in Python may need to be exported into slides, copied into spreadsheets, or recreated in BI tools before anyone else can use them operationally.
Quadratic keeps visual outputs attached to the spreadsheet workflow itself. DataFrames generated from pandas can feed directly into charts, summaries, dashboards, and reporting layers within the same file.
A revenue operations team could use pandas to segment accounts, calculate retention cohorts, and aggregate expansion revenue trends, then immediately build visual dashboards alongside the transformed data. Formulas, Python outputs, and charts remain synchronized in one environment rather than scattered across notebooks and presentation tools.
Visualization in Quadratic can also be done using text prompts:
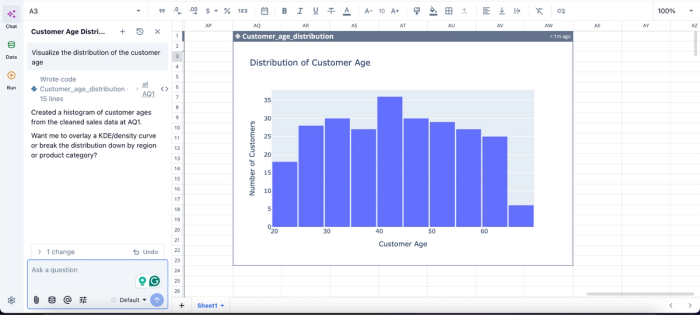
In this image, I ask Quadratic AI to “Visualize the distribution of the customer age.” In seconds, it creates a visualization of the distribution of customer age.
Share pandas-powered spreadsheets without requiring local Python environments
One of the largest adoption barriers for Python-based workflows is environment management. Sharing a notebook or script often requires teammates to install dependencies or troubleshoot version mismatches before they can even review the analysis.
Quadratic removes that operational overhead through a collaborative analytics platform. Teammates can open the spreadsheet and review charts without setting up Python locally. This becomes especially valuable for cross-functional teams where analysts and managers all need access to the same workflow but may not share the same technical background.
Getting started with pandas for Excel users
The lowest-friction on-ramp in Pandas for Excel workflows is to take one task you already do in Excel and rebuild it with Pandas in a spreadsheet grid. Pick something concrete and bounded.
Rebuild it once with pandas inside a spreadsheet, see the DataFrame render in the grid, and notice where you stop reaching for Excel out of habit and where you stop reaching for a notebook out of necessity. Browser-based spreadsheet-native Python skips the local environment setup that often blocks people from trying pandas at all. There is nothing to install.
Quadratic allows you to use pandas directly to clean, transform, and analyze data in a spreadsheet-native workflow. The visibility gap that trips up most spreadsheet users does not have to be the price of moving to pandas. Keep the grid, keep your data in view, and let pandas handle the parts Excel was never built for. Try Quadratic for free.
Frequently asked questions (FAQs)
How can I compare two Excel files for differences in Python pandas?
Pandas makes this straightforward with a merge using an indicator column or a direct comparison that produces a diff DataFrame. Instead of sorting two sheets side by side and eyeballing for changes, you can generate a diff in a few lines of code that shows exactly which rows are new, changed, or missing.
How does Quadratic solve the visibility gap that trips up spreadsheet users moving to pandas?
Quadratic is a browser-based spreadsheet that lets you write pandas code directly in cells. When your code returns a DataFrame, it renders as inspectable cells in the grid rather than a hidden printout. This means your cleaning code, cleaned data, downstream formulas, and visualizations all coexist in one place, keeping the spatial workflow and visibility that made Excel work for you while giving you pandas' power.
Can I use pandas to generate graphs from Excel data without exporting back to Excel?
Yes. Once your data is clean in pandas, you can use pandas or a charting library to produce visualizations placed directly in your spreadsheet. In a tool like Quadratic, the chart, the cleaned data, and the cleaning logic all sit in the same file.