
James Amoo, Community Partner
Apr 30, 2026

Selecting a new data analysis tool is a strategic decision that impacts your entire organization. It goes far beyond a simple feature comparison on a vendor pricing page. The truth is, the best product isn't a single solution. Instead, the best software for data analysis is the ones that perfectly align with your team's operational reality and daily workflows.
This guide will walk you through how to assess your internal capabilities and evaluate the best data analysis tools on the market. We will cover how to measure your team's data maturity, the key criteria you should use to balance speed and trust, and how modern platforms are bridging the gap between traditional spreadsheets and robust coding workflows.
Why the right choice depends on your data maturity
An organization's current data architecture and internal expertise must dictate its software requirements. Before looking at external vendors, you have to look inward. You need to balance the daily requirements of non-technical users and citizen developers with the advanced modeling needs of data scientists.
Often, growing companies hit a critical transition point where they simply outgrow traditional methods. Scaling data analysis operations, stricter compliance rules, and massive volume limitations force teams to seek the best software for data analysis that won't crash under pressure.
It is also crucial to evaluate your existing data analytics strategy. If your data engineering team is overwhelmed, an enterprise-grade deployment might create more bottlenecks. In that case, a lightweight and agile solution might be the better fit. Ultimately, finding the best tools for data analysis means matching the software's capabilities to the actual skill levels and technical support available within your company.
Key criteria for evaluating the best data analysis tools
When procuring new platforms, teams need to move beyond basic nice-to-have features and focus on core decision axes. Evaluating the best data analysis software requires looking at how a tool solves actual business bottlenecks rather than just checking boxes on a vendor sheet. The top data analysis tools are built to accelerate workflows, handle modern data loads, and foster alignment across departments. Here is how to evaluate your options based on real-world operational needs.
Speed and flexibility for ad hoc workflows
Modern teams must balance the need for structured, automated reporting with the ability to perform ad hoc data exploration. If you implement tools that are too rigid or require heavy IT intervention just to change a query, you will inevitably slow down business teams that need immediate answers.
The interface of your chosen platform directly impacts how fast operators can test hypotheses and pivot their analysis when new questions arise. The best tools for data analysis provide a flexible environment where users can rapidly explore datasets without waiting for a centralized data team to build a new dashboard.
Handling data volume and complexity
Traditional spreadsheets like Excel and Google Sheets are famous for their flexibility, but they quickly hit a wall, often driving users to seek an Excel alternative. We have all experienced the frustration of a spreadsheet lagging or crashing because a file is simply too large.
Modern evaluation must prioritize coding spreadsheets capable of handling true scale without sacrificing performance. The best software for data analysis will offer seamless integration directly with existing data warehouses, databases, and APIs.
Real-time collaboration and trust
A major gap in many traditional platforms is the lack of multiplayer, real-time collaboration. In modern data environments, working in isolation is a liability. When team members download files to their local machines, it inevitably leads to conflicting reports and a breakdown in data integrity.
A shared workspace builds trust in the data. It ensures everyone is looking at the same numbers at the same time. The best data analysis tools feature robust collaborative environments where technical and non-technical team members can work together seamlessly. This allows peers to audit logic and align on the final output before it reaches leadership.
Bridging the gap: spreadsheets, code, and AI
For a long time, organizations have been led to believe in a false trade-off: either rely on the flexible nature of spreadsheets or adopt the code-driven capabilities of traditional BI tools. That assumption is now being reshaped. With the emergence of hybrid workflows, both business users and technical teams can operate within a shared environment.
Furthermore, artificial intelligence has emerged as a practical accelerant. The best AI tools for data analysis are integrated systems that automate data processing and generate initial insights.
By combining the agility of a spreadsheet with native coding capabilities and embedded artificial intelligence, teams can perform AI spreadsheet analysis much faster. Ultimately, the top AI tools for data analysis empower users to do things manually if they choose, but also offer spreadsheet automation to do the heavy lifting. Finding the best AI tool for data analysis means looking for this seamless blend of familiar UX and intelligent automation.
How Quadratic fits your analytical workflow
Quadratic bridges the gap between a flexible spreadsheet interface and robust programmatic analysis. It combines native SQL, Python, formulas, and AI capabilities within a single workspace. This means your team can go from pulling raw data to building dashboards without losing the familiar agility of a spreadsheet. Let’s explore the the features of Quadratic in detail:
Direct connections to multiple sources
Quadratic integrates directly with databases, APIs, and raw data, enabling real-time access to both structured and unstructured data. This eliminates the need for manual exports and ensures that analyses are always based on synchronized datasets.
For analytical workflows, this means faster iteration and fewer data integrity issues. Analysts can query live data, join multiple sources, and build models on top of continuously updating inputs.
AI-powered data analysis
Quadratic integrates AI directly into the analysis layer, allowing users to automate tasks such as data cleaning, anomaly detection, and predictive analytics. Instead of writing complex logic from scratch, analysts can leverage AI to accelerate repetitive processes and uncover patterns that might otherwise go unnoticed.
This capability is particularly valuable for exploratory data analysis, where speed and flexibility are critical. Teams can quickly test hypotheses and refine models without being constrained by manual workflows or limited tooling. Let’s see how this works.
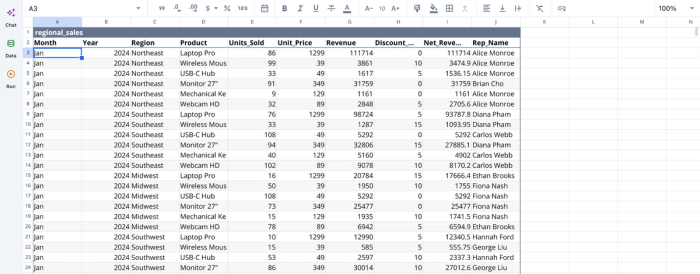
First, I import my data into Quadratic:
After successfully importing our data into Quadratic, we can immediately begin analysis:
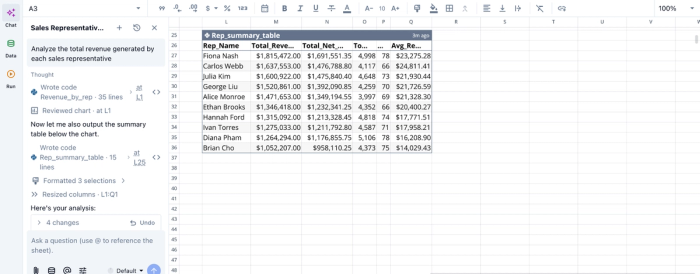
In this image, I ask Quadratic AI to “Analyze the total revenue generated by each sales representative”. It generates a table that shows the total revenue of each representative, alongside the total net revenue, total units sold, and average revenue per transaction. Quadratic allows users to perform basic and advanced analysis by using text prompts.
AI data visualization
Data visualization in Quadratic is integrated within the spreadsheet, allowing users to generate charts, dashboards, and summaries directly from live datasets. AI-assisted visualization helps surface key insights automatically.
Since these visualizations are dynamic, they update in real time as underlying data changes. This ensures that stakeholders always have access to the most accurate and up-to-date view of performance metrics. Visualization in Quadratic also works by using simple text prompts. Here’s an example:
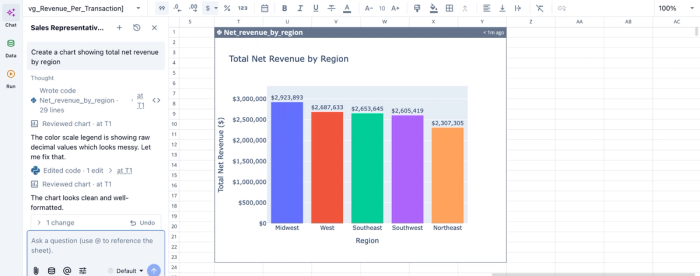
In this image, I ask Quadratic AI to “Create a chart showing total net revenue by region”. In seconds, it creates a bar chart showing the rank of revenue by region. Users do not need to specify the chart type; Quadratic intelligently suggests the most appropriate chart type based on their dataset.
Native support for programming languages
Quadratic supports Python, SQL, and spreadsheet formulas within the same interface. Analysts can use SQL for database querying, Python for data analysis, and formulas for quick calculations.
This allows teams to choose the right tool for each task while maintaining a single source of truth. It also reduces the friction typically associated with moving data between notebooks, BI tools, and spreadsheets.
Interactive exploration and ad hoc analysis
Unlike static BI dashboards, Quadratic supports interactive data exploration. Analysts can filter, segment, and drill down into datasets in real time.
This empowers teams to respond quickly to new questions or anomalies. Rather than waiting for data engineering support, analysts can independently explore data and generate insights on demand.
Collaboration
Modern analytics is inherently collaborative, and Quadratic is designed to support real-time teamwork. Multiple users can work on the same dataset simultaneously, share insights, and build on each other’s analyses without version control conflicts.
This collaborative analytics platform provides built-in change tracking and audit logs. This is especially important for organizations that require reproducibility and accountability in their data processes.
Conclusion: choosing the right tool for your team
Choosing the best data analysis tools requires aligning your software selection with your team's specific workflows and technical maturity levels. Moving beyond static dashboards and legacy systems requires a deliberate balance of speed and flexibility.
By prioritizing solutions that connect directly to your live data and foster real-time collaboration, you can eliminate bottlenecks and empower your entire team to make smarter decisions. Whether you need the agility of a spreadsheet or the power of the best data analysis software on the market, the right choice will transform how your organization operates.
Try Quadratic for free and see how fast you can go from raw data to shareable insight.
Frequently asked questions (FAQs)
What defines the best data analysis software for an organization?
The best data analysis software isn't a one-size-fits-all solution; it depends on your team's data maturity and existing infrastructure. It must effectively balance the needs of both non-technical operators and advanced data scientists to truly be considered the top data analysis tools.
How do modern data analysis tools address large data volumes and collaboration challenges?
Modern data analysis tools are designed to handle significant data volumes and complexity by connecting directly to live data sources, avoiding the limitations of traditional spreadsheets. They also foster real-time collaboration, ensuring all team members work from a single source of truth.
How does Quadratic serve as the best AI tool for data analysis for diverse teams?
Quadratic uniquely combines a familiar spreadsheet interface with native Python, SQL, formulas, and AI capabilities in a collaborative environment. This allows both coders and non-coders to analyze live data, perform complex modeling, and ensure consistent insights across the organization.