
James Amoo, Community Partner
May 26, 2026

Table of contents
The promise of AI Excel analysis is genuinely exciting. Ask a question in plain English, get an instant summary. Drop in a messy dataset, watch a chart appear. Request a forecast, receive a number. For anyone who has spent hours wrestling with pivot tables and nested formulas, the appeal is obvious.
However, there is a quiet problem hiding inside most AI data analysis Excel workflows: the AI rarely shows its work. You ask a question, an answer appears, and you are left to trust it. No formula. No code. No reproducible path from input to output. When a colleague asks how you arrived at the number, you are stuck.
This article argues that AI Excel analysis is only useful when it is inspectable, auditable, and reusable. We will look at the trust gap that opaque chat-based tools create, define what good AI analysis actually looks like in a spreadsheet, walk through the capabilities that matter, and outline practical workflows that hold up to scrutiny.
What AI Excel analysis actually means today
AI Excel analysis covers a wide and growing landscape. It includes Copilot-style assistants embedded directly in Microsoft Excel, third-party add-ins that layer chat interfaces onto the grid, and newer spreadsheet products that build AI into the analysis surface from the ground up. Excel with Copilot AI driven data analysis has popularized the idea that you can simply describe what you want and let the assistant handle the mechanics.
The capabilities most searchers expect are reasonably consistent: natural language querying of a dataset, automated chart generation, and formula or function suggestions. Python and SQL for data analytics in the spreadsheet have also emerged as an important bridge, giving users access to statistical libraries and data wrangling tools that pure formula work cannot match.
What changes from tool to tool is not really the surface capability. Most AI for Excel analysis can answer a question or produce a chart. The real question, and the one this article is built around, is whether you can trust and verify what the AI produces.
Quadratic streamlines AI Excel analysis by generating formulas, Python, SQL, and charts transparently inside the spreadsheet grid itself, rather than hiding the logic behind a chat response. Since the analytical steps remain visible and editable, users can inspect calculations, validate assumptions, and collaborate on the same analysis without losing control over the underlying logic.
Core capabilities to look for in AI tools for Excel data analysis
The first step to adopting AI spreadsheet analysis is choosing the best AI tool that fits your workflow. In this section, we’ll make your decision easier by exploring the core capabilities to look for in AI tools for data analysis.
Natural language querying that returns code, not just answers
Asking questions in plain English is now table stakes for any AI analysis Excel tool. The differentiator is what you get back. A tool that returns only a number is asking you to trust it. A tool that returns a number plus the formula or query that produced it is showing you its work.
Look for behavior like this: when you ask, "What was our average order value by region last quarter?" the AI should write a visible formula, query, or Python block that filters and aggregates the data. You can then read it or save it as part of a reusable model.
Python and formula generation inside the grid
Formulas remain the most transparent calculation layer in any spreadsheet. They are short and deterministic. The best AI for Excel data analysis should generate formulas where formulas are the right tool, not bypass them in favor of opaque output.
Python matters for the work formulas cannot do well: predictive analytics, AI data modeling, and anything that benefits from a real programming environment. Strong AI tools for Excel data analysis generate Python that you can read, edit, and rerun in place.
Automated charting and visualization
Charts are one of the most common expected outputs of AI analysis. The transparency test for any chart the AI produces is simple: can you see and edit the underlying data range, the aggregation, and the chart configuration? Established data visualization best practices consistently emphasize that editable chart configurations are a prerequisite for trustworthy reporting. A chart you can edit is a chart you can trust. A chart you cannot edit is a screenshot.
Clean data input and preparation
AI analysis quality depends heavily on clean input. Headers in the right place. Consistent types per column. No merged cells in the data range. AI can absolutely help with data cleaning, splitting, deduplicating, and reformatting. If the AI silently drops rows or coerces types, you need to be able to see it and decide whether that was the right call.
Practical AI Excel analysis workflows
After you’ve made your choice on the best AI tool for data analysis, the next step is diving into the use cases. However, most analysts do not know just how much these tools help streamline their workflow. In this section, we’ll explore the most practical AI Excel analysis use cases you can adopt in your workflows.
Trend analysis on time-series data
Suppose you have daily sales data and want to understand the trend. With an inspectable AI workflow, you ask for a trend analysis, and the AI returns either a formula-based moving average or a Python block that computes a smoothed series and a slope.
The output is editable, so you can change the smoothing window, exclude an outlier period, or switch from a simple moving average to an exponential one without re-prompting from scratch. The chart that visualizes the trend updates with your changes.
Automated summaries and reporting
Extracting summaries from raw data is a common ask. The AI can read a table and produce a written summary of what changed, what stood out, and what is worth attention.
The trick is keeping the underlying aggregation logic visible. If the summary says "revenue grew 12% in the West region," there should be a corresponding formula or query in the sheet that produced that 12%. When next month's data arrives, the same logic recomputes the number, and the summary can regenerate. That is the difference between a one-time narrative and a repeatable report.
Reusable models and repeatable analysis
The biggest payoff of inspectable AI data analysis Excel work is spreadsheet automation and repeatability. You build the analysis once, with formulas and code visible in the grid, and then rerun it whenever the data changes. New month, same model. New customer cohort, same model.
This is only possible when the AI's outputs live in the grid as code and formulas rather than as chat replies. A chat reply is a moment in time. A model in the sheet is infrastructure. For anyone evaluating the best AI for data analysis Excel, this is the property that matters most over the long run.
How Quadratic fits: auditable AI analysis in a spreadsheet
Quadratic is purpose-built for this transparency thesis. It is an AI-powered spreadsheet where the AI generates formulas, Python, and charts directly into the cells of the grid. There is no separate chat panel where conclusions appear without a path back to the data. Let’s explore the features of Quadratic in detail.
Analyze live operational and financial data without leaving the grid
Quadratic is built around a fundamentally different approach to AI Excel analysis. The spreadsheet itself becomes the analytical environment, not just the destination for copied AI outputs. Instead of bouncing between chat tools, exported CSVs, and disconnected dashboards, users can connect directly to databases, APIs, spreadsheets, and cloud data sources from within the same browser-based workspace.
This matters because trustworthy analysis depends on continuity between the raw data and the conclusion. In Quadratic, imported Excel files, SQL queries, and AI-generated summaries all remain connected inside one shared grid. Analysts can move from data processing to transformation to reporting without losing context or creating fragmented workflows that become impossible to audit later.
For recurring financial reporting workflows, this creates a far more sustainable system. Live data connections ensure dashboards and models update automatically as the source changes, while the analytical logic remains attached directly to the underlying dataset instead of disappearing into external scripts.
Explain and audit inherited spreadsheets faster
One of the most practical use cases for AI Excel analysis is understanding spreadsheets you did not build. Quadratic streamlines this process by allowing users to import existing Excel files and immediately ask AI to explain formulas, summarize workbook structure, identify dependencies across sheets, and flag inconsistent logic.
Instead of manually tracing references through dozens of tabs, analysts can generate readable summaries of how the workbook operates, where assumptions live, and which formulas may be introducing risk. Quadratic AI can surface duplicated calculations, mixed data types, broken references, and suspicious outliers before teams begin modifying the file.
Use Python for workflows that outgrow formulas
Traditional spreadsheets become fragile when analytical complexity increases. Long nested formulas and hidden logic chains create models that are difficult to maintain and risky to modify. Quadratic solves this by combining native spreadsheet formulas with native Python and SQL execution inside the same workspace.
Users can leverage AI to generate Python code for data cleaning, forecasting, categorization, anomaly detection, statistical modeling, or API retrieval directly in the grid. Instead of forcing every workflow into increasingly unreadable formulas, teams can shift complex logic into inspectable Python scripts while still preserving spreadsheet accessibility.
Generate AI-powered analysis with visible logic
Most AI spreadsheet tools optimize for speed of output. Quadratic optimizes for inspectability. When the AI generates a formula, Python transformation, chart, or summary, the underlying logic is written directly into the spreadsheet cells where anyone reviewing the workbook can inspect and edit it.
In Quadratic, there is no hidden reasoning layer. Users can see exactly how a metric was calculated, which formulas were applied, what Python transformations were executed, and how charts were generated from the source data.
Finance teams can validate assumptions before sharing reports. Operators can debug workflows without rebuilding them from scratch. The spreadsheet becomes an auditable analytical system rather than a static output document.
Here’s an example:
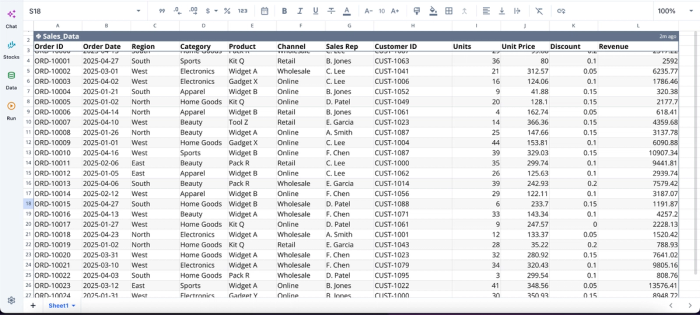
Once we have our data in Quadratic, we can immediately get into AI analysis in Quadratic:
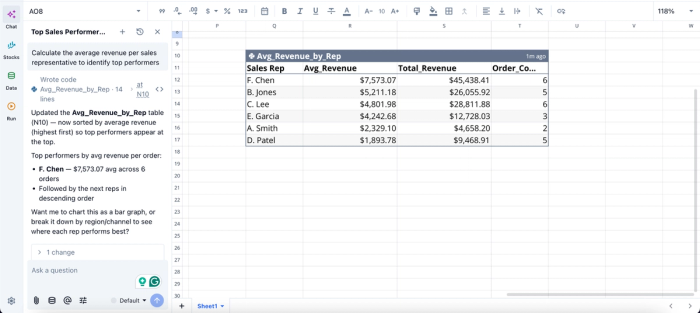
In this image, I ask Quadratic AI to “Calculate the average revenue per sales representative to identify top performers.” It instantly generates a table that shows the average revenue per representative, including the total revenue and order count for each sales rep.
Build dashboards where the analysis and visualization stay connected
In many analytics stacks, charts become disconnected from the logic that produced them. A dashboard may show a trend, but tracing that number back to its transformation logic often requires jumping across multiple tools and environments.
Quadratic keeps visualizations directly attached to the analysis itself. Users can ask AI to generate dashboards, identify anomalies, or compare datasets directly alongside the underlying tables and code. The chart remains part of the analytical workflow.
This creates a much stronger foundation for reusable reporting. When the data refreshes, the formulas, summaries, and visualizations refresh together. Analysts can immediately inspect how a chart was built, modify or refine the visualization without recreating the workflow elsewhere.
Here’s an example:
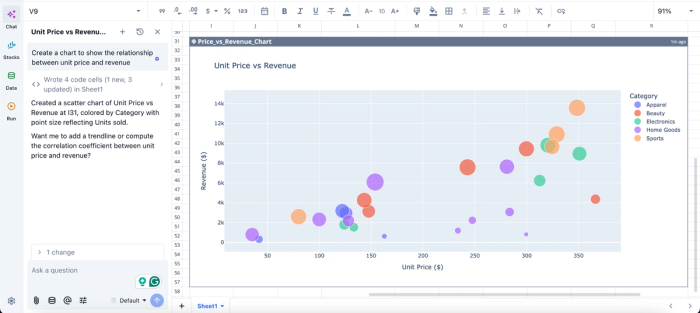
In this image, I ask Quadratic AI, “Create a chart to show the relationship between unit price and revenue.” It instantly creates a scatter plot that visualizes the relationship between the price and revenue.
Collaborate on transparent AI workflows
AI-generated analysis becomes significantly more useful when teams can review it together. Quadratic is designed for collaborative workflows where formulas, Python scripts, charts, and AI-generated explanations remain visible to everyone working in the file.
This eliminates the common problem where analytical context lives inside a private AI conversation that nobody else can access later. In Quadratic, the logic stays embedded in the spreadsheet itself. A teammate reviewing the model can inspect the exact code that transformed the data and the prompts that generated summaries or visualizations.
The result is a much stronger operational audit trail. Instead of sharing static spreadsheets with hidden assumptions, teams share inspectable workflows that remain readable, editable, and reproducible over time.
Conclusion: choose an AI analysis you can trust
AI Excel analysis is only as valuable as your ability to inspect, edit, and rerun what it produces. Opaque chat answers feel fast in the moment, but they create downstream risk every time someone needs to verify a number or hand the work off. Inspectable outputs do the opposite. They turn one-off answers into durable workflows you can build on.
Quadratic offers an AI-powered spreadsheet alternative for Excel analysis, chart generation, and creation of reusable models. It allows you to use formulas, Python, and AI in the same grid, ensuring every result stays visible and ready to run again on tomorrow's data. Try Quadratic for free.
Frequently asked questions (FAQs)
How does Quadratic help with transparent AI Excel analysis?
Quadratic is an AI-powered spreadsheet where every output lands directly in the grid, not in a separate chat panel. This means you can read the logic behind any result, edit it without restarting a conversation, and rerun the analysis whenever your data changes.
What should I look for when evaluating AI tools for Excel data analysis?
Look for tools that return code or formulas alongside answers, support both formula and Python generation in the same workspace, and produce editable chart configurations rather than static images. Verify that outputs stay in the grid so they remain reproducible and can be shared as part of a reusable model. Avoid tools where analysis logic disappears after you leave a chat session.
Can I use free AI tools for Excel data analysis effectively?
Free tools can be useful for testing, but evaluate them by the same transparency standards as paid options. Ask whether the tool shows the formula or code behind every answer, whether you can edit those outputs and rerun them on new data, and whether the logic persists in your file or only in a chat history. A free tool that meets these criteria will deliver far more value long-term than a free tool that doesn't.
