
James Amoo, Community Partner
May 26, 2026

Data analysts exploring the best Excel assistant for data analysis rarely want a tutorial. They want faster formulas, cleaner data, quicker charts, and plain-English explanations of sheets they didn't build. They want the friction out of their day. They want the next step to just happen.
The problem is that most tools marketed as an AI assistant for Excel are chatbots, and if you're looking for a ChatGPT alternative that actually works inside your data rather than beside it, the distinction matters enormously. They sit beside the workbook in a side panel or a separate browser tab, answer your question, and then hand the result back to you as text you still have to paste into a cell. That gap, small as it sounds, is where most of the value leaks out.
This article makes a simple argument: the best Excel assistant is one that lives inside the spreadsheet itself, not next to it. When the AI writes directly into the grid, every formula, every cleaned column, and every chart becomes part of the actual workflow rather than a suggestion you have to transcribe.
What embedded AI means in a spreadsheet
Embedded AI is a clear idea: the AI produces output in the grid, not in a side conversation. AI embedded in workflows helps by understanding context and revealing next steps, which the most advanced implementations extend further with AI agents for analysis that can chain tasks and apply data transformations autonomously. This collapses the four pillars of formula generation, cleanup, analysis, and charts into one continuous workflow instead of four separate tasks performed in four separate places.
Context is built in. An embedded assistant already sees the sheet, so prompts can be shorter and outputs can be more accurate. You don't need to describe your column structure or paste in a sample. The assistant knows what's there. Outputs are first-class spreadsheet objects. A formula generated by AI is just a formula. A cleaned dataset is just data. A chart is just a chart. Each one is editable, inspectable, and reusable like anything else in the workbook.
This is where Quadratic is particularly strong. Quadratic embeds AI directly into the spreadsheet environment itself, allowing formulas, Python, SQL, charts, and AI-generated transformations to coexist inside the same live grid. Instead of AI acting as an external assistant that comments on your spreadsheet, it becomes part of the spreadsheet workflow itself, which makes the entire analysis process more transparent and collaborative.
What an Excel AI assistant is supposed to do
Before judging where an AI assistant should live, it helps to be specific about what it should do. Across every exploration for Excel assistance, the same handful of jobs come up. A capable Excel AI assistant should handle all of them well and treat them as parts of one workflow rather than five disconnected features.
Formula generation and checking
Formula generation is the most common reason people look for Excel formula assistance. A good assistant should be able to write a formula from a plain-English description of what you want, debug or explain a formula that's already in a cell, and suggest a simpler or more efficient alternative when a formula is doing too much.
The bar is whether the formula ends up in your sheet, ready to edit, or in a chat window you have to copy from.
Data cleaning
Most real spreadsheets are messy. An assistant should handle the unglamorous work: removing stale data, standardizing date and currency formats, splitting or merging columns, and filling or flagging missing values.
Data cleaning also means reshaping. Wide tables become long ones. Free-text fields get parsed into structured columns. These are tasks that fall squarely within the scope of spreadsheet automation for analysts who want to stop doing repetitive work by hand. The point is to get the data into a form that's actually analyzable, without an hour of manual nudging.
Analysis and summarization
Once the data is clean, the next question is usually "what does this show?" That includes pivot-style summaries, trend identification, and quick aggregations across categories or time, the core of what good AI spreadsheet analysis is designed to handle. A strong assistant can answer questions about the data directly, with output that lives next to the underlying numbers rather than floating in a separate response.
Chart and visualization creation
Charts are the natural endpoint of analysis, not a standalone feature. The right assistant picks the chart type that fits the question being asked, rather than defaulting to whatever bar chart is easiest to render. Better still, the chart should update as the analysis evolves, not freeze in place the moment it's generated.
Explaining a sheet you didn't build
You inherit a workbook from a coworker, a former employee, or your past self from two quarters ago. The logic is dense, the assumptions are implicit, and the dependencies are scattered.
A good assistant walks you through what the sheet is doing: which inputs feed which outputs, where the assumptions live, and what would break if you changed a particular cell. That kind of Excel spreadsheet explanation is hard to get from a chatbot that can't actually see the sheet.
What changes when your Excel assistant lives in the grid
The day-to-day feel of working with an embedded Excel AI assistant is different in ways that compound. Formula assistance becomes iterative rather than transactional. You don't ask, copy, and close the chat. You write a formula, refine it, and replace it as your understanding of the question evolves. Cleanup happens on the actual data, not on a copy of it. Standardizing dates or removing duplicates produces a cleaned column you can keep working with, not a description of steps you still need to perform.
Charts update as the analysis evolves. When the underlying numbers change or you adjust a calculation, the visualization reflects it. The chart is part of the workflow, not a screenshot of a moment. Explanations reference real cells. When you ask the assistant to walk through a sheet you inherited, it can point to actual addresses and dependencies rather than a paraphrase. Excel formula assistance becomes specific to your file, not generic advice.
How Quadratic fits: an AI assistant that lives inside the spreadsheet
Quadratic is built around this embedded model. It generates formulas, writes Python, cleans data, builds charts, and explains sheet logic, all directly in the grid. There's no chat panel you transcribe from. Let’s see how it fits as the best Excel AI assistant.
Connect live data sources directly into the workflow
Traditional chatbot assistants typically operate on static snapshots of spreadsheet data. Once the export changes, the workflow has to be repeated manually. Quadratic instead treats live data as a native part of the spreadsheet workflow.
Quadratic supports direct connections to APIs, databases, CSVs, operational systems, and imported Excel files within the same workspace. AI-generated formulas, Python scripts, and dashboards operate directly on live connected data instead of disconnected exports.
This is especially valuable for recurring reporting environments. Revenue dashboards, operational scorecards, marketing analytics, financial models, and KPI tracking systems can continuously refresh as the underlying source data updates.
Preserve context across the entire workflow
A major weakness of external spreadsheet chatbots is context fragmentation. The reasoning behind a generated formula or transformation often disappears once the conversation ends, leaving future collaborators with outputs they cannot fully interpret.
Quadratic preserves context because the prompts, formulas, charts, and outputs all remain embedded in the same workspace. Anyone opening the spreadsheet later can inspect how the workflow was built, why certain calculations exist, and how the analysis evolved.
This becomes especially important for collaborative environments where multiple analysts contribute to the same workbook. Instead of institutional knowledge living inside private chat histories, the reasoning stays attached directly to the analytical workflow itself.
Generate formulas and calculations in context
External spreadsheet chatbots often generate generic formulas because they cannot fully understand the workbook structure, the relationships between tabs, or the live data inside the file. Users still have to manually adapt the output to fit the sheet.
Quadratic operates with direct visibility into the active spreadsheet environment. It has full visibility into the structure of the workbook, connected datasets, column names, and existing logic, so the formulas it generates are grounded in the actual analysis rather than hypothetical examples.
This makes formula generation much more practical for operational work. Users can ask the AI to build lookup logic, cohort analyses, rolling averages, forecasting models, or financial reporting directly in the sheet. The resulting formulas remain editable like any normal spreadsheet formula, which means teams can continuously refine and audit the logic instead of relying on opaque generated outputs.
Use embedded Python and SQL when formulas stop scaling
Every spreadsheet eventually reaches the point where formulas become difficult to read and maintain. Nested IF statements, chained lookups, and large transformation pipelines often create workbooks that are fragile and nearly impossible to debug collaboratively.
Quadratic addresses this by embedding native Python and SQL execution directly into the spreadsheet grid. Users can prompt the AI to generate Python scripts for data cleaning, forecasting, or financial modeling without leaving the spreadsheet environment.
The key difference is that the generated Python remains fully visible and editable. Analysts can inspect every transformation step, modify logic inline, and rerun workflows against updated data without switching tools or maintaining separate notebooks.
Use AI directly in the sheet instead of copying between tools
Most AI spreadsheet workflows still depend on a fragmented interaction model. You ask a chatbot for help, copy the output into Excel, test whether it works, then return to the chatbot when something breaks. The spreadsheet and the AI operate as separate systems, which means context gets lost constantly.
Quadratic removes that separation by embedding the AI directly into the spreadsheet environment itself. Formulas, Python scripts, summaries, transformations, and charts are generated directly into the grid where the data already lives. There is no intermediate copy-paste layer and no disconnect between the prompt and the execution environment.
This changes the workflow fundamentally. Instead of treating AI as an external advisor, Quadratic treats it as an operational layer inside the spreadsheet. Prompting, editing, debugging, refinement, and sharing all happen in the same browser-based workspace, making the entire analytical process substantially faster and easier to maintain.
Let’s see how this works using a sample dataset:
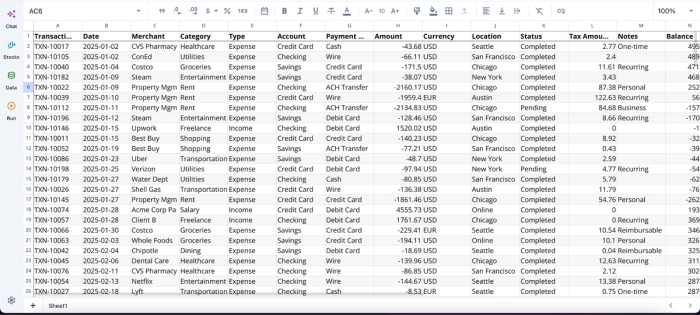
Once you have our data in the grid (either by import or direct connection), you can immediately begin AI spreadsheet analysis. Here:
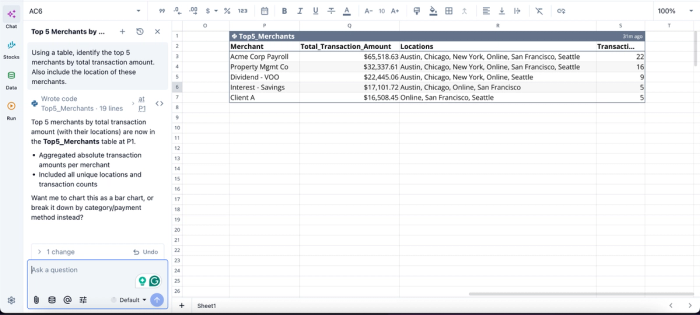
In this image, I prompt Quadratic AI, “Using a table, identify the top 5 merchants by total transaction amount. Also include the location of these merchants.” It instantly generates a table that shows the top 5 merchants, including the total transaction amount, locations, and number of transactions.
Build visualizations where the logic stays attached
One of the biggest limitations of external AI assistants is that visualizations often become disconnected from the underlying analytical workflow. The chart exists separately from the formulas and assumptions that produced it.
Quadratic keeps charts and dashboards directly connected to the spreadsheet logic. Users can ask AI to recommend visualizations, generate charts, summarize patterns, or highlight outliers directly inside the grid.
This is particularly useful for operational and financial reporting where traceability matters. Teams can immediately inspect the formulas, Python transformations, or source tables behind any chart without leaving the workspace.
Here’s an example:
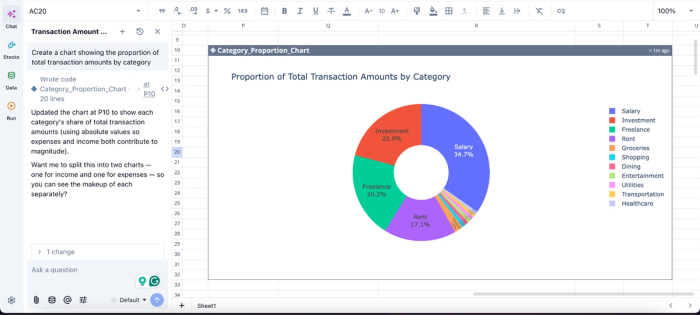
In this image, I ask Quadratic AI to “Create a chart showing the proportion of total transaction amounts by category.” In seconds, it creates a pie chart that displays the total transaction amounts by category. Users do not need to write complex code or export to external BI tools; Quadratic AI creates dynamic and highly interactive visualizations from simple text prompts.
Collaborate on AI-assisted workflows in real time
Spreadsheet workflows rarely belong to one person forever. Reports get handed off, models get inherited, and dashboards evolve across multiple contributors. Quadratic is designed around collaborative analytical work rather than isolated spreadsheet sessions.
It is browser-based and multiplayer by design, which means teams can collaborate on AI-assisted workflows in real time. One analyst can clean incoming data while another adjusts formulas, a third refines Python logic, and a manager reviews the generated dashboards simultaneously inside the same workspace.
Most importantly, the AI-generated logic remains visible to everyone involved. Formulas, Python scripts, summaries, and charts are not hidden behind private prompts or disconnected assistant panels. The workflow itself becomes collaborative and reusable across the organization.
Conclusion
The framing that matters isn't which Excel assistant has the most features on a comparison table. It's where the AI lives. Tools that sit beside the workbook will always make you the integrator, copying answers into cells and cleaning up output by hand. Tools that live inside the grid let the AI do the work where the work actually happens.
The practical payoff is straightforward: less friction, fewer transcription errors, faster iteration, and output you can edit like anything else in your sheet. Formulas, cleanup, analysis, and charts stop being four separate jobs in four separate panels and become one continuous workflow.
Quadratic functions as an AI spreadsheet assistant for formulas, analysis, cleanup, and charts in one place. Try Quadratic for free.
Frequently asked questions (FAQs)
Can an AI assistant write Excel formulas for me?
Yes, most can. The more useful question is whether it writes the formula into your sheet or into a chat box. A formula generated in a chat panel still has to be transcribed and adjusted by hand. A formula generated directly in the cell is ready to edit and reuse like anything else you'd write yourself, making iteration faster and reducing transcription errors.
How does Quadratic provide Excel formula assistance differently?
Quadratic generates formulas directly in the grid rather than in a separate chat panel, so every formula lands in a cell where you can inspect and edit it immediately. Because Quadratic can see your actual spreadsheet and data, its suggestions are specific to your workbook rather than generic examples. This embedded approach collapses formula writing, cleanup, analysis, and charting into one continuous workflow instead of four separate tasks in separate places.
What's the difference between Microsoft Excel assistance tools and an embedded AI spreadsheet?
Most Microsoft Excel assistance tools layer a chatbot on top of the workbook, with output appearing in a side conversation you have to transcribe from. An embedded AI spreadsheet places the AI inside the grid itself, so output lands in cells, charts, and live calculations rather than in a chat. The capabilities can look similar on a feature list, but the workflow feels very different in practice because you avoid the copy-paste friction entirely.
