James Amoo, Community Partner
May 19, 2026

Table of contents
- What "explaining" a spreadsheet actually requires
- Step 1: Orient yourself before touching any formulas
- Step 2: Map the components of the workbook
- Step 3: Trace the logic: precedents, dependents, and data flow
- Step 4: Surface the assumptions baked into the workbook
- Step 5: Turn understanding into a cleaner workflow
- Explain Excel spreadsheets with Quadratic AI
- Frequently asked questions (FAQs)
You opened the file this morning. It's named something like FY24_Forecast_v7_FINAL_updated.xlsx; it has fourteen tabs, three of them are hidden, and the person who built it left the company eight months ago. There's no documentation. No README file. Just a wall of formulas and a deadline.
If you’re exploring how to explain Excel spreadsheet, your ideal expectation should be to understand a specific workbook without breaking it. You need the Excel spreadsheet explained the way someone would explain a codebase: what does it do, where does the logic live, and what assumptions is it making?
Here's the honest framing: when you inherit an Excel file, the hard part is reconstructing intent, logic, and assumptions baked into a workbook by someone you can no longer ask. This post lays out a structured approach for doing that quickly, plus how AI tools can compress hours of manual archaeology into minutes.
What "explaining" a spreadsheet actually requires
To explain spreadsheet in MS Excel terms, you have to address three interconnected layers at once: the structure of the workbook, the logic powering the calculations, and the intent behind why the model was built in the first place. Structure refers to how sheets, ranges, tables, and named references are organized across the workbook. Intent involves understanding the assumptions and operational goals that shaped the workbook originally.
Most traditional Excel auditing tools only address the middle layer. Trace Precedents will show you which cells feed a formula. It won't tell you that the 0.0825 buried in a SUMPRODUCT is a sales tax assumption from 2019 that nobody updated.
The emotional reality matters too. There's no documentation, no original author, and high stakes if you change the wrong cell. A small edit can quietly break a downstream report that an executive sees on Monday morning. A reality that Deloitte's analysis of spreadsheet risk controls underscores when it asks who is accountable for a workbook's output and whether its assumptions are still appropriate. That's why the order of operations matters: you orient before you trace, and you understand intent before you touch anything.
Step 1: Orient yourself before touching any formulas
Before you do anything else, create a copy of the workbook and work only inside that duplicate version. Renaming the file immediately helps establish a clean audit trail and prevents accidental edits to the production workbook. One of the most common mistakes people make with inherited spreadsheets is experimenting directly in the original file, only to discover later that formulas, links, or formatting changes have already altered downstream outputs.
Once the file is safely duplicated, spend time orienting yourself before tracing any formulas. Inventory all visible and hidden sheets by checking the tab bar and reviewing the VBA editor for “very hidden” tabs that do not appear in the standard unhide menu. Scan for frozen panes, grouped rows or columns, and any tabs labeled “README,” “Notes,” or “Instructions.” At this stage, your goal is to build a solid data infrastructure and analytics strategy by categorizing sheets into inputs and outputs so you understand how the workbook is organized before attempting to decode its logic.
Step 2: Map the components of the workbook
Once you understand the workbook’s high-level structure, the next step is cataloging its internal components. This means building a working inventory of everything the file contains, including worksheets, named ranges, and external data connections. Complex workbooks often rely heavily on workbook-scoped names and hidden supporting ranges that quietly drive critical calculations behind the scenes.
You should also identify all external dependencies and assumptions embedded into the workbook architecture itself. Review links to other Excel files, database connections, and any macros or VBA scripts that may alter workbook behavior dynamically. Distinguishing between formula-driven cells and hardcoded values is especially important because hardcoded values are often undocumented assumptions rather than permanent constants.
Step 3: Trace the logic: precedents, dependents, and data flow
The real power of Microsoft Excel comes from its dependency graph: cells referencing other cells in long chains of calculations. Decoding an inherited workbook means understanding how information flows through that graph. Begin with Excel’s built-in tracing tools, including Trace Precedents, Trace Dependents, Show Formulas, and Evaluate Formula. These features allow you to inspect how formulas interact and how outputs are ultimately generated from raw inputs.
As you trace dependencies, focus on identifying “hub” formulas. These hub cells usually contain the workbook’s key business rules and assumptions. It also helps to sketch a simple sheet-to-sheet data flow diagram showing how raw data moves through data transformation layers into final reporting outputs. Native Excel tracing tools become increasingly difficult to manage in large workbooks, especially when references span many sheets, which is why AI spreadsheet analysis becomes valuable once manual dependency tracing starts breaking down.
Step 4: Surface the assumptions baked into the workbook
The highest-risk part of any inherited workbook is usually not the formulas themselves, but the assumptions hidden inside them. A formula like =Revenue*0.22 may look harmless, but that single number could represent an outdated policy decision from years ago that nobody remembers validating.
You should systematically review every formula for hidden assumptions and fallback behavior. Look for hardcoded values, threshold logic inside IF statements, lookup defaults wrapped in IFERROR functions, and rounding conventions that may compound across large models. The goal is to identify which numbers represent immutable truths and which are actually business policies or temporary estimates. Producing a documented list of these assumptions alone puts you ahead of most spreadsheet inheritance processes, where assumptions remain invisible until they cause reporting failures later.
Step 5: Turn understanding into a cleaner workflow
Once you fully understand the workbook’s structure and assumptions, you can decide what should be preserved or rebuilt entirely. Many inherited spreadsheets become unnecessarily fragile because complex business processes were forced into formulas that Excel was never designed to handle elegantly.
You should also reduce unnecessary complexity while preserving the underlying business logic. Long nested formulas can often be replaced with cleaner lookup tables or structured workflows that separate inputs, transformations, and outputs into clearly defined layers. This makes the workbook significantly easier to audit and update when business conditions change
Explain Excel spreadsheets with Quadratic AI
Quadratic helps modernize this process by combining spreadsheets, Python, SQL, and AI-assisted analysis in a single environment. Instead of forcing every workflow into increasingly brittle formulas, you can move data modeling or data wrangling logic into Python directly beside the spreadsheet grid while still maintaining transparency and auditability. Let’s explore the features of Quadratic in detail.
Import inherited Excel files without losing the underlying logic
The first challenge when working with an unfamiliar workbook is preserving the original structure while making it understandable. Quadratic allows users to import existing .xlsx files directly into a browser-based spreadsheet environment with formulas and tab structures intact. Instead of flattening the workbook into static data, it preserves the logic chain so users can inspect how calculations flow across sheets and dependencies.
This becomes especially useful for inherited budgeting systems and financial reporting workbooks that have evolved over the years without proper documentation. Rather than reverse-engineering formulas cell by cell, users can immediately begin tracing relationships and mapping the structure of the workbook in one unified workspace.
Connect spreadsheet logic to live databases and APIs
Many Excel workflows break down because the underlying data becomes disconnected from live systems. Users export CSVs, paste updated figures manually, and introduce inconsistencies across accounting dashboards. Quadratic eliminates much of this friction by allowing spreadsheets to connect directly to APIs, databases, and live external data sources.
This means inherited workbooks can evolve from static snapshots into continuously updated systems. Financial reports can pull live stock market data, operational trackers can sync with databases, and reporting sheets can refresh automatically without requiring manual intervention.
By combining external data connectivity with spreadsheet-native workflows, users can modernize existing Excel systems incrementally instead of rebuilding everything from scratch in separate BI tools.
Replace fragile spreadsheet logic with Python and SQL
One of the biggest risks in legacy Excel systems is formula sprawl. Over time, complex workbooks become difficult to maintain because business logic is distributed across thousands of interconnected cells. Quadratic addresses this by allowing users to replace fragile spreadsheet logic with native Python and SQL directly in the same grid.
For example, instead of maintaining deeply nested conditional formulas across multiple sheets, users can use Python to centralize transformation logic into readable scripts. SQL can be used to query, filter, and aggregate large datasets directly inside the spreadsheet environment without exporting data into separate tools.
This creates a far more auditable workflow. Anyone reviewing the workbook can inspect the original data, the formulas, the Python logic, and the outputs in one location.
Use AI to explain formulas, dependencies, and workbook intent
Most spreadsheet auditing tools only reveal references. They do not explain why the workbook was built the way it was. Quadratic’s built-in AI closes this gap by allowing users to ask natural-language questions about formulas, ranges, or entire sheets directly inside the spreadsheet.
Instead of decoding a deeply nested INDEX MATCH, SUMPRODUCT, or multi-sheet conditional formula manually, users can ask the AI to explain the logic in plain English, summarize how calculations connect, or identify the business assumptions embedded in the workbook. This reduces the time required to understand legacy spreadsheets and helps teams move from “What does this formula do?” to “What operational decision is this workbook actually supporting?”
Quadratic AI can also identify repetitive logic patterns and suggest cleaner alternatives. This makes spreadsheet automation far more practical, especially when working with large financial or operational models that have accumulated years of incremental edits.
Let’s see how this works. First, I import my dataset from Excel:
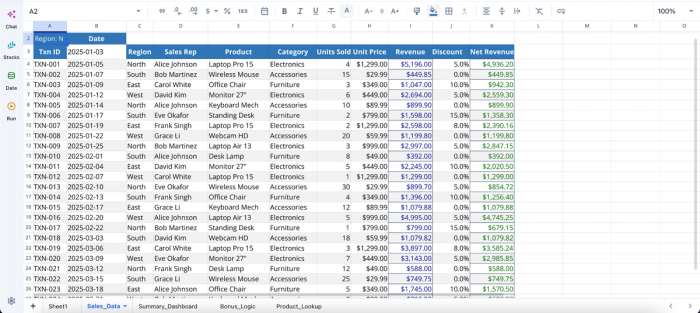
After successfully importing my Excel data to Quadratic, I can immediately begin generating insights using text prompts:
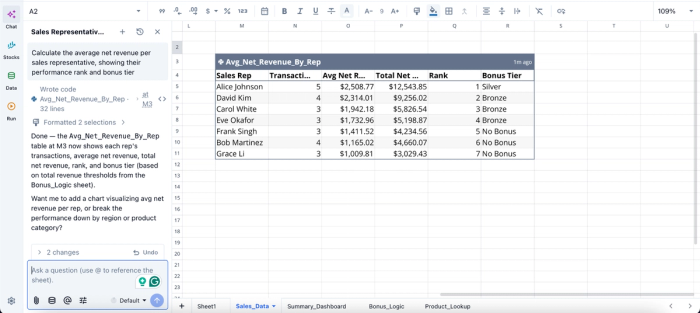
In this image, I ask Quadratic AI to “Calculate the average net revenue per sales representative, showing their performance rank and bonus tier.” It instantly creates a table that shows each rep's transactions, average net revenue, total net revenue, rank, and bonus tier.
Rebuild static reports into dynamic analytical dashboards
Traditional spreadsheets like Excel and Google Sheets often end as static reporting artifacts. Once the logic becomes too difficult to maintain, teams stop improving the workflow and rely on manual refreshes and exported reports. Quadratic enables teams to evolve these files into dynamic analytical systems without abandoning the spreadsheet interface entirely.
Users can create interactive data visualization directly on top of imported Excel models, combining tables, charts, notes, formulas, and Python-generated visualizations in the same workspace.
This is particularly valuable when inherited spreadsheets serve as the backbone of recurring operational reporting. Instead of distributing multiple exported versions of a workbook, teams can collaborate around a single live analytical environment. Visualization in Quadratic can also be done by using text prompts:
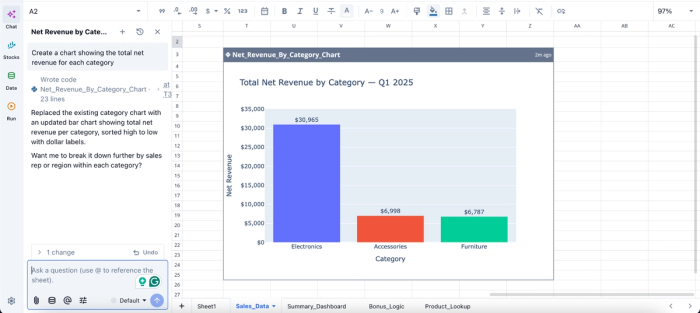
In this image, I ask Quadratic AI, “Create a chart showing the total net revenue for each category.” In seconds, it creates a bar chart that displays the total next revenue by category. From the chart, we can see that the electronics category has the highest revenue with $30,965.
Collaborate around explanations instead of tribal knowledge
One of the most dangerous aspects of complex spreadsheets is institutional dependency. Often, only one employee understands how the workbook functions. When that person leaves, the spreadsheet becomes operationally risky. Quadratic addresses this problem by making explanations, logic, and documentation visible directly inside the workbook itself.
Teams can collaborate in real time while keeping formulas and outputs side by side. Analysts reviewing the workbook later can immediately understand not just the calculations, but the reasoning behind them.
This creates a persistent audit trail that dramatically improves maintainability and trust. Instead of relying on undocumented spreadsheet folklore, organizations gain a collaborative analytics platform where logic remains transparent and transferable over time.
Frequently asked questions (FAQs)
How do I trace formulas across multiple sheets?
Use Trace Precedents and Trace Dependents from the Formulas tab, plus Show Formulas (Ctrl + `) to view all formulas at once. Native tracing breaks down across sheets in large workbooks, so for cross-sheet dependencies, AI-assisted explanation is usually faster and more reliable.
What are the main components of an Excel spreadsheet explained?
Cells, rows, columns, and ranges form the foundation. On top of those sit formulas, named ranges, Excel Tables, pivot tables, charts, data validation rules, and external references or data connections. Workbook-level objects include named ranges scoped to the whole file, macros, and connections to external data sources. When someone asks for the components of an Excel spreadsheet worksheet explained, this is the list.
How can Quadratic help me explain an Excel spreadsheet faster?
By importing your Excel file into Quadratic, you can ask the AI to summarize the workbook's purpose, explain specific formulas in plain English, list hardcoded assumptions, and map sheet dependencies. This turns hours of manual reverse-engineering into a conversation, compressing the archaeology so you can spend your time on decisions that matter instead of cell-by-cell tracing.