
James Amoo, Community Partner
Jun 1, 2026

Table of contents
- Where Excel breaks down for serious analysis
- Why Jupyter notebooks and Python scripts aren't a real Excel replacement
- What a true python-native spreadsheet should do
- How to evaluate the best Python tools for Excel users
- How Quadratic fits: a python-native spreadsheet built for this gap
- Keep the grid, gain Python
- Frequently asked questions (FAQs)
There's a familiar moment in every analyst's career: the workbook starts crashing, the formulas stretch off the screen, and the manual data refresh takes longer than the analysis itself. At that point, the search begins for a Python alternative to Excel that can effortlessly handle real datasets and spreadsheet automation.
Here's what most articles miss. The people running this search are trying to keep the grid and gain Python's power. The real question isn't "Python or Excel?" It's "How do I work in a spreadsheet that doesn't fall over when the analysis gets serious?"
This article walks through where Excel breaks down, why notebooks and standalone scripts fall short as replacements, how to evaluate "Python in Excel" honestly, and what a true Python-native spreadsheet should do. By the end, you'll have a framework for choosing the right tool, not just the most popular one.
Where Excel breaks down for serious analysis
The debate around Excel and Google Sheets is well-worn, but Excel is one of the most successful pieces of software ever built. It's also a tool that quietly imposes a ceiling on serious analytical work. The cracks tend to show up in predictable places, and they're usually what push people to look for a Python Excel alternative in the first place.
Row and file-size limits. Financial models, transaction logs, and event data outgrow Excel quickly. Workbooks slow to a crawl, then refuse to open at all. Brittle formulas and hidden references. Long formula chains break silently. A single misaligned reference can ripple through a model, and spreadsheet errors are a well-documented source of risk in financial reporting.
Weak version control and auditability. Shared workbooks become a tangle of "_final_v3_FINAL.xlsx" files with no clear history of who changed what. Loops, conditionals, predictive modeling and analytics, and machine learning don't fit naturally into a formula language. You can fake it with array formulas and helper columns, but you're working against the tool.
This is where Quadratic changes the equation. Instead of forcing teams to choose between spreadsheets and code, Quadratic combines the spreadsheet interface people already understand with native Python, SQL, AI-assisted analysis, and live data connectivity in the same environment. Analysts can still work in a familiar grid, but they are no longer constrained by formula-only logic or legacy workbook architecture.
Why Jupyter notebooks and Python scripts aren't a real Excel replacement
When analysts decide they need an Excel alternative with Python power, the default recommendation is usually a Jupyter notebook. It's a reasonable starting point for learning Python, but it's not a real replacement for the way Excel actually gets used.
Notebooks abandon the grid. The grid is the interface that analysts and stakeholders use to read, validate, and explore data. A dataframe printed inside a notebook cell is not the same as a sheet you can scroll, filter, and click through.
Out-of-order execution creates hidden state. Notebook cells can be run in any order, and the live state of variables often diverges from what's written on screen. For iterative analysis, where you're constantly tweaking inputs and checking outputs, this fragility is a real problem. Sharing is harder than it looks. Sending a finance partner or executive a .ipynb file is not the same as sharing a workbook. They need a runtime, the right libraries, and a reason to learn an unfamiliar interface.
Standalone scripts split logic from output. A Python script can clean and transform data beautifully, but the result usually ends up exported back to Excel for review. Now you have two artifacts to maintain, and you've recreated the original brittle pipeline. Notebooks and scripts are excellent for what Jupyter notebooks were designed to do, but they were not designed to replace the grid-based data exploration that makes Excel valuable.
What a true python-native spreadsheet should do
If notebooks throw away the grid and Python in Excel constrains the runtime, the missing category is a spreadsheet that treats Python as a native language. The best Python tools for Excel users in this space share a specific set of properties. They preserve the grid so cells, ranges, and formulas continue to work the way spreadsheet users already think. At the same time, they run native Python directly in cells rather than through a sidecar pane or remote service. Code lives in the sheet itself, outputs appear naturally in the grid, and Python has access to the libraries and workflows analysts actually rely on. Just as importantly, these data science tools connect directly to live data sources like databases, APIs, and warehouses, eliminating the constant cycle of manual exports and re-imports that traditional spreadsheet workflows depend on.
The deeper advantage is workflow unification. The transformation logic, statistical model, visualization, and final presentation all live in the same file instead of being fragmented across notebooks, scripts, dashboards, and exports.
How to evaluate the best Python tools for Excel users
Once you accept that the right answer is a coding spreadsheet, the next question is how to compare options. The practical evaluation framework is less about feature checklists and more about workflow fit. Start with grid familiarity. Can existing spreadsheet users become productive immediately, or does the tool force them into a developer-first environment? Native code execution matters just as much. In some products, Python is bolted on through a separate pane or a remote service. In others, code is treated as a first-class part of the spreadsheet itself. That distinction changes how naturally formulas, code, and analysis fit together.
Live data access and workflow unification are the next pressure points. Serious analytical work rarely lives in static CSV exports forever. Databases, APIs, and external systems become part of the workflow quickly, so built-in connectivity matters. The same is true for keeping work unified in one place. If the data, code, charts, and outputs are scattered across notebooks and dashboards, the coordination overhead compounds fast.
Collaboration and governance are usually what determine whether a tool survives beyond experimentation. Non-technical teammates still need to read and review outputs without setting up a Python environment. Large datasets need to perform without constant workbook corruption or slowdown. Shared analytical work also requires reproducibility and some form of version control so teams can explain Excel spreadsheet logic, understand what changed, and why. The strongest spreadsheet analysis tools are the ones that preserve the accessibility of spreadsheets while adding the engineering capabilities that modern analytical workflows now require.
How Quadratic fits: a python-native spreadsheet built for this gap
Quadratic was built specifically for the gap this article describes. It's a spreadsheet first, with a familiar grid where formulas behave the way Excel users expect. Then it adds native Python and SQL directly in cells, executed locally, so you're not waiting on a cloud service or working around library restrictions. Let’s explore the capabilities of Quadratic in detail.
Connect live business data instead of relying on exports
Traditional Excel workflows often depend on recurring exports from CRMs, warehouses, analytics tools, or finance systems. Those exports create version-control problems almost immediately. Analysts spend time checking timestamps and rebuilding accounting dashboards after every refresh.
Quadratic shifts the workflow from static files to connected analysis. Direct connections with databases and APIs, rather than relying on a brittle Excel connect to SQL Server setup, allow spreadsheets to pull current data directly into the sheet. Instead of rebuilding reports from scratch every reporting cycle, analysts refresh the connection and rerun the same logic against updated inputs.
This becomes especially valuable for recurring operational workflows. Revenue dashboards, KPI tracking, and inventory reporting all benefit from a spreadsheet that behaves more like a live analytical environment than a one-time document.
Combine code and formulas instead of replacing one with the other
Many “Python versus Excel” conversations frame the tools as mutually exclusive. Real workflows rarely work that way. Analysts often need both lightweight spreadsheet logic and heavier programmatic analysis, like using pandas for Excel, in the same project.
Quadratic is built around coexistence rather than replacement. Formulas remain useful for fast calculations, references, and lightweight business logic. Python handles transformations, automation, statistical work, and larger datasets. For those used to workarounds for SQL in Excel, native SQL manages database analytics and aggregation against connected systems.
This model maps naturally to how modern analytical work actually happens. An operations manager does not need to become a software engineer to benefit from Python, and a data scientist does not need to abandon the usability of spreadsheets to gain programmatic power.
Use AI to accelerate analysis without hiding the logic
AI assistance in spreadsheets often breaks down at the exact moment workflows become serious. An external Excel assistant or chatbot may generate an answer or a code snippet, but the reasoning and execution are usually detached from the spreadsheet itself. Analysts still need to copy results back manually and validate what happened.
Quadratic approaches AI differently. AI-generated formulas, Python code, transformations, and summaries are written directly into the spreadsheet cells. The generated logic stays inspectable and editable, acting as a built-in Excel formula explainer, which means analysts can verify assumptions and rerun workflows without starting over.
An analyst looking to clean messy spreadsheet data from vendor exports could prompt the AI to identify inconsistent date formats, remove stale data, and generate a summary of anomalies. The result is not a temporary conversation hidden in a side panel. It is executable logic embedded directly in the sheet where the work actually happens. Let’s see an example.
First, I import a sample HR data into Quadratic:
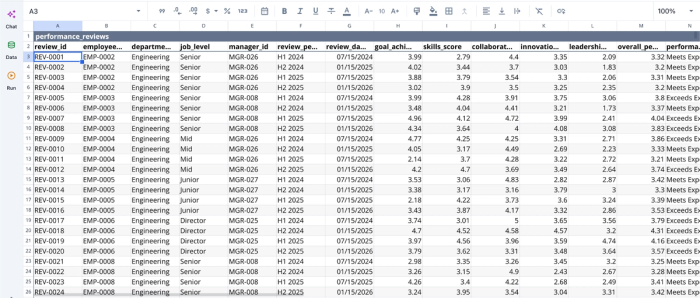
After successfully importing my data, I can immediately begin analysis:
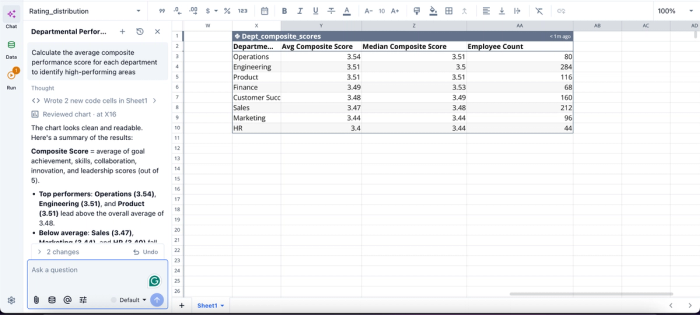
In this image, I ask Quadratic AI to “Calculate the average composite performance score for each department to identify high-performing areas.” It instantly creates a table that shows the average composite for each department in the organization, alongside the median composite score and employee count.
Turn Python analysis into spreadsheet-native visualizations
Visualization is another area where traditional Python workflows often create friction. Analysts move from notebooks to plotting libraries to presentation tools, exporting charts at each stage and losing interactivity along the way.
Quadratic keeps visualization attached to the data pipeline itself. Python-generated outputs, SQL query results, and spreadsheet formulas can all feed directly into charts and dashboard components inside the same environment, making building Excel dashboards seamless.
A growth team could use SQL data analytics to query campaign data from a connected database, calculate customer acquisition efficiency with Python, and generate charts tracking CAC trends and regional performance side by side in the same sheet. Updating the source data updates the downstream visuals automatically.
Users do not have to write complex Python code for visualization; all they have to do is ask using text prompts:
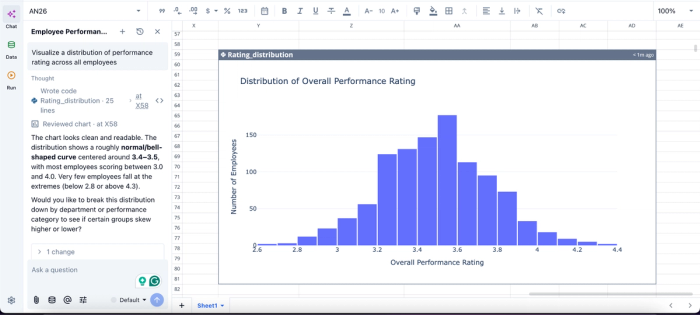
In this image, I ask Quadratic to “Visualize a distribution of performance rating across all employees.” In seconds, it creates a chart that displays the distribution of the overall performance rating. From the chart, we can see that most employees score between 3.0 and 4.0.
Share live analytical workspaces instead of static files
Collaboration is one of the clearest limitations of traditional Excel-plus-Python workflows. Scripts live locally, and spreadsheets are emailed around as disconnected copies.
Quadratic replaces that model with a collaborative analytics platform where data, code, formulas, and visualizations all remain synchronized. Teams collaborate inside the same live sheet rather than exchanging exported artifacts.
A finance team reviewing quarterly performance can see the same Python logic and connected datasets in real time. An analyst updating a transformation pipeline does not need to explain which script version produced the latest dashboard. The workflow itself is visible to everyone with access.
Keep the grid, gain Python
The real takeaway is straightforward. The best Python alternative to Excel isn't leaving the spreadsheet. It's upgrading it.
Notebooks throw away the grid. Standalone scripts force you back into export pipelines. Python in Excel adds code but keeps you tethered to a constrained cloud runtime. The category that actually solves the problem is a Python spreadsheet that runs native Python alongside formulas and live data, in one file, on your machine.
Move from Excel to a Python-native spreadsheet workflow in Quadratic without giving up the spreadsheet familiarity, formulas, and AI-assisted analysis. Try Quadratic for free.
Frequently asked questions (FAQs)
Is Python better than Excel for data analysis?
Python is more powerful for large datasets, complex logic, statistical work, and automation. Excel is faster for ad-hoc exploration, simple models, and sharing with non-technical users. The better question is whether you can have both at once, which is what a Python-native spreadsheet provides.
How does Quadratic work as a Python alternative to Excel?
Quadratic is a spreadsheet built specifically for this gap. It preserves the familiar grid while running native Python directly in cells on your machine, not in the cloud. You can write Python code in a cell, reference its output in formulas or other cells, connect to live databases and APIs, and keep all your data, logic, and output in one file.
Can I use Python inside Excel directly?
Yes. Microsoft offers Python in Excel, which lets you write Python in cells. The trade-off is that code runs in the cloud, library access is curated, and connectivity options are limited. It's a useful bridge, but not a full replacement for tools where Python runs natively and locally.