James Amoo, Community Partner
Jun 1, 2026

Table of contents
When an analyst working in a data science spreadsheet explores SQL in Excel, they're rarely looking for a database tutorial. They're sending a signal. This means that their formulas, pivots, and manual joins have hit a wall, and they need a faster way to perform spreadsheet analysis.
The trigger moment is usually familiar. You're trying to join two large tables that should match on a customer ID, but a chain of XLOOKUPs is producing inconsistent results. When you connect spreadsheets in Excel and aggregate across five sheets, the pivot table often takes thirty seconds to refresh. You're filtering a few hundred thousand rows, and Excel starts dragging. At that point, SQL for data analytics stops being an academic concept and starts looking like the right tool for the job.
This article walks through what using SQL in Excel actually means today. The standard workarounds, where they break, and what a native SQL coding spreadsheet looks like when SQL is treated as a first-class citizen alongside formulas and charts.
Can you use SQL in Excel? The short answer
Yes, with caveats. Excel does not ship with a native SQL editor where you can simply type a query against your sheet and see results directly in the grid. What it offers instead is a collection of connector-based approaches that provide SQL or SQL-like behavior from inside the workbook. Power Query uses the M language and an ETL-oriented workflow, though it supports native database analytics for some sources.
Microsoft Query (MS Query) is the older built-in option for running SQL against ODBC-connected databases. Excel also supports ODBC and OLE DB connections to systems like SQL Server, PostgreSQL, and MySQL (which is how many connect Excel to SQL Server), while VBA with ADO allows users to execute SQL queries from macros. Beyond Microsoft's tooling, there are also third-party add-ins and external query editors that embed SQL interfaces into the spreadsheet workflow.
Each approach comes with tradeoffs. Some are difficult to configure, some depend heavily on IT-managed drivers and permissions, and most treat SQL results as imported tables rather than something that behaves as a native part of the spreadsheet itself. That distinction matters because analysts often want SQL to participate directly in the grid alongside formulas, charts, and downstream calculations.
What SQL solves that Excel formulas don't
If you want to know whether to use SQL query in Excel for a given problem, it helps to map common SQL operations directly to the spreadsheet pain points they replace.
Joins replace chains of VLOOKUP, XLOOKUP, and INDEX/MATCH across sheets. A single JOIN clause expresses the relationship between two tables clearly, without dragging formulas down 200,000 rows or worrying about lookup direction.
Filters (WHERE clauses) replace nested IF statements and helper columns. Instead of stacking conditions across multiple cells, a WHERE clause states the exact rows you want in one place.
Aggregations (GROUP BY) replace pivot tables that recalculate slowly or break when the source range shifts. GROUP BY is explicit, repeatable, and version-controllable in a way that pivot configurations are not.
Subqueries and CTEs replace stacked helper sheets and intermediate tabs. Instead of building a chain of "Sheet2_clean," "Sheet2_filtered," and "Sheet2_aggregated," you express the intermediate steps inline and keep the workbook lean.
The point is that for relational operations on tabular data, SQL is the language those operations were designed for, and trying to execute a SQL query in Excel for SQL data analytics is often the natural next step once formula-based approaches stop scaling.
Where Excel workflows break down
The cracks tend to show up in the same places. Performance is usually the first thing analysts encounter. Excel's row limits and recalculation model make multi-million-row analysis either painfully slow or completely impractical, emphasizing the need to optimize the data analytics strategy. Tasks that databases and query engines handle comfortably become fragile inside a spreadsheet designed around cell-by-cell recalculation.
The second issue is reliability. Multi-sheet joins built with VLOOKUPs, XLOOKUPs, INDEX/MATCH combinations, or helper columns are notoriously brittle, often requiring an Excel formula explainer just to untangle the logic. A misaligned key column or a hidden formatting inconsistency can silently produce incorrect outputs that survive for weeks before anyone notices. SQL, by contrast, makes the data transformation logic explicit. A query describes exactly how rows were filtered, grouped, joined, and aggregated, which makes it easier to explain Excel spreadsheet logic and share reasoning across a team.
This is where Quadratic helps by combining spreadsheets, SQL, Python, formulas, and charts inside the same collaborative environment. Instead of pushing complex joins and transformations into fragile formulas scattered across worksheets, users can run SQL queries directly in the grid while keeping the spreadsheet interface that analysts already understand.
How to use SQL in Excel today: the standard approaches
Here are the standard ways to run SQL in Excel, with their honest tradeoffs.
Option 1: Power Query (closest built-in path)
Power Query is the closest thing Excel has to a built-in data wrangling environment. You can import data from files, databases, and APIs, then merge, filter, and reshape it through a UI that records steps in the M language. Some connectors expose a native database query pass-through option that lets you paste raw SQL through to the source.
Limitations: M is not SQL. The UI-driven editor is slow for anything beyond the basics, collaboration is weak (each user has their own queries), and performance degrades on larger datasets. If your goal is to use SQL queries in Excel directly, Power Query is a detour, not a destination.
Option 2: Microsoft Query and ODBC connections
To run SQL query in Excel against an external database, the traditional path is Data → Get Data → From Other Sources → From Microsoft Query, or a direct ODBC/OLE DB connection. You point Excel at a connection string, pick a table, or write a SQL statement, and the result lands in the workbook as a static table.
Limitations: the UI is dated, parameterizing queries with cell values is awkward, and the returned table is essentially a one-way dump. You cannot reference the SQL result mid-query the way you'd reference a range in a formula, and refreshing requires manual or scheduled triggers.
Option 3: VBA with ADO
For users comfortable with code, VBA combined with ADO (ActiveX Data Objects) lets you execute SQL query in Excel programmatically. You build a connection string, open a recordset, run a SQL statement, and write the results into a sheet.
Limitations: VBA is a maintenance burden, security prompts get in the way of sharing, and the logic is opaque to non-developer collaborators, leading many to seek alternatives to VBA. It works, but it's the kind of solution that becomes one person's responsibility forever.
Option 4: Add-ins and external SQL editors
A handful of third-party add-ins embed a SQL pane inside Excel, letting you write queries against the workbook or an external connection. Some are genuinely useful for specific workflows.
Limitations: another tool to license and learn, and the results still tend to be detached from the cells around them. You're querying alongside Excel rather than inside it.
Quadratic: the best SQL in Excel tool
Quadratic is built around exactly that idea. It's a browser-based spreadsheet where you can write spreadsheet SQL queries directly in a cell, against connected databases like Postgres, MySQL, Supabase, and Snowflake, or against data already in the sheet. The results land in the grid next to your formulas, Python cells, and charts, so the entire analysis stays in one place. Let’s explore the features of Quadratic in detail.
Keep recurring reporting workflows connected to live data
Many Excel reporting processes fail at the refresh stage. Analysts repeatedly export CSVs from operational systems, rebuild joins, paste new data into workbooks, and spend hours validating whether formulas still reference the correct ranges.
Quadratic reduces that maintenance burden through direct database and API connections embedded directly into the spreadsheet environment. SQL queries operate against current data sources rather than static exports.
A marketing analytics team, for example, could connect campaign performance data from a warehouse, query weekly conversion metrics, and maintain rolling dashboards that refresh against fresh inputs instead of requiring manual imports every reporting cycle.
Replace fragile lookup chains with readable SQL logic
One of the biggest pain points in Excel analysis is relational work performed through spreadsheet formulas. Multi-sheet XLOOKUP chains, INDEX-MATCH combinations, helper columns, and manually maintained joins become increasingly fragile as datasets grow.
Quadratic offers a cleaner path by allowing joins and aggregations to happen directly through SQL cells inside the spreadsheet. A workflow that once required several intermediate sheets can become a single readable query whose logic stays visible in the grid.
A finance team reconciling invoices against payment records, for example, can blend both datasets directly and join them with SQL instead of building layers of helper formulas. The result appears as spreadsheet data that downstream formulas and charts can reference normally.
Blend SQL, Python, and spreadsheet formulas in one analytical model
Most spreadsheet tools force analysts to choose between formulas and code, complicating workflows like using Python in Excel. SQL lives in one tool, Python in another, and spreadsheets somewhere else entirely. That separation introduces friction every time the workflow crosses environments.
Quadratic is designed around a unified analytical model where SQL, Python, and formulas all coexist in the same canvas. Each language handles the work it is best suited for.
SQL can retrieve and aggregate relational data. Python can perform predictive analytics, reshaping, or forecasting. Spreadsheet formulas can handle lightweight calculations and presentation logic directly beside the outputs.
A growth team analyzing subscription retention might use SQL to pull transactional records, pandas to calculate cohort analysis, formulas to compute KPI tracking, and charts to visualize retention curves, all without leaving the spreadsheet.
Use AI to generate SQL for analysis directly in the sheet
Writing SQL is powerful, but it can still become a bottleneck for analysts who understand the business question more clearly than the syntax needed to answer it, prompting many to ask, can ChatGPT create Excel spreadsheets?
Quadratic embeds AI assistance directly into the spreadsheet workflow so users can describe the analysis they want in natural language and generate SQL inline. The important distinction is that the generated query becomes visible and editable inside the spreadsheet itself.
An analyst could ask the AI to compare monthly revenue by region, identify customers with declining order frequency, or calculate average contract value across segments. The resulting SQL appears directly in a cell where it can be inspected and shared with teammates.
Here’s an example of AI-powered analysis in Quadratic:
Now that we have our data in Quadratic, we can immediately begin analysis:
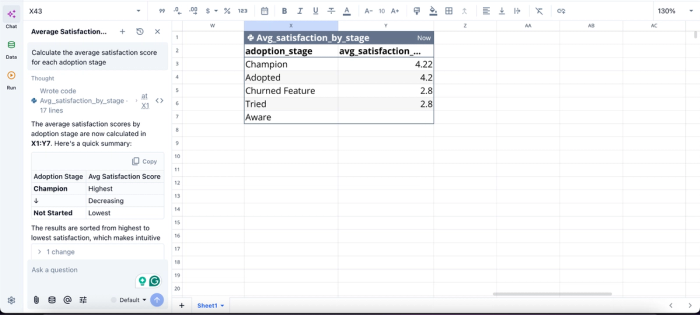
In this image, I ask Quadratic AI, “Calculate the average satisfaction score for each adoption stage.” It instantly creates a table that shows the average satisfaction score across all users.
Build dashboards from live SQL outputs without leaving the grid
Traditional BI tools often separate querying from visualization. Data is queried in one environment, exported into another tool, then rebuilt into dashboards elsewhere.
Quadratic keeps the full workflow together. SQL query outputs flow directly into spreadsheet-native charts, summary tables, and dashboards without requiring a separate reporting layer.
A sales operations team could query pipeline data from a connected CRM database and build visual dashboards directly beside the underlying query results. When the database updates, rerunning the query refreshes the downstream charts automatically.
With the use of simple text prompts, users can generate dynamic visualizations in Quadratic right from the spreadsheet:
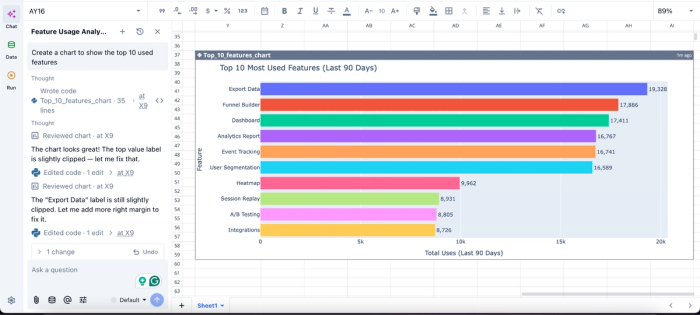
In this image, I ask Quadratic AI to “Create a chart to show the top 10 used features.” In seconds, it generates an interactive chart that shows the top 10 most used features in the application, based on my dataset.
Share SQL-powered spreadsheet workflows across teams
One of the persistent problems with SQL-heavy analysis is accessibility. Query logic often ends up trapped in BI tools, local notebooks, or isolated analyst environments that business teams cannot easily inspect.
Quadratic keeps the SQL logic, outputs, charts, and spreadsheet calculations together in one collaborative analytics platform. Since the platform is browser-based, users can leverage real-time collaboration and direct contribution without reconstructing the workflow elsewhere.
An executive stakeholder may focus on the dashboard layer while an analyst reviews the SQL powering it, and a data engineer validates the connected source. Everyone works against the same live spreadsheet instead of fragmented exports and disconnected reports.
Takeaway: stop working around the spreadsheet
Exploring SQL in Excel is a signal, not a syntax question. It usually means your formulas, pivots, and manual joins have stopped keeping up with the data, and you're looking for a more direct way to express what you actually need.
The fix is a spreadsheet where SQL belongs in the grid, next to your formulas and charts, with no detour through a separate query editor.
Quadratic allows you to use SQL directly to analyze and transform spreadsheet or connected data without Excel workarounds. Try Quadratic for free.
Frequently asked questions (FAQs)
Can you use SQL in Excel directly?
Not in a native SQL editor. Excel does not include a built-in cell-level SQL environment, though you can run a SQL query in Excel by connecting through Power Query, Microsoft Query, ODBC, or VBA with ADO. Each of these routes SQL through a connector rather than letting you write SQL inline as a cell type, which is why many analysts find the experience clunky.
What's the difference between Power Query and SQL?
Power Query uses the M language, which is a functional transformation language driven largely by a UI. SQL is a declarative query language designed for relational data. Power Query is good for repeatable import-and-shape pipelines, while SQL is better when you need expressive joins, aggregations, and filters against structured data.
How does Quadratic solve the SQL-in-Excel problem?
Quadratic treats SQL as a first-class cell type, so you write a query directly in a cell, results spill into the grid, and downstream formulas, charts, and other code cells reference those results without any detour. You can query connected databases like Postgres, MySQL, Supabase, and Snowflake, or run SQL against data already in the sheet, keeping your entire analysis in one place instead of being split across a query editor and a spreadsheet.