James Amoo, Community Partner
May 19, 2026

You open a spreadsheet someone else built. Maybe it came from a colleague who left, a vendor, or a finance team three reorgs ago. The first thing you see is a cell containing a formula like =IF(IFERROR(VLOOKUP(...),0)>1000,IF(...,VLOOKUP(...),0),IF(...)), with hardcoded thresholds, references to a sheet named "Sheet3 (2)", and no documentation. You need to use this file by Friday.
Reaching for an Excel formula explainer is the natural first move. You want someone, or something, to translate this wall of nested logic into plain English so you can move on with your day. That is a reasonable starting point. But if you stop there, you have only solved half the problem. The real job is to decide whether you can trust it to build a solid data infrastructure and analytics strategy. "Explain this Excel formula" is step one. The full workflow looks more like this: explain, audit, simplify, and rebuild.
Quadratic helps streamline this process by combining spreadsheet logic, AI-assisted explanations, and programmable analysis inside a single collaborative environment. Instead of manually tracing deeply nested formulas cell by cell, users can have Excel formulas explained with examples using AI. This post walks through each stage, including where Excel's native tools help and where AI-assisted explanation and rewriting take you the rest of the way.
How to read a complex Excel formula
Before reaching for spreadsheet automation, it helps to develop a manual framework for decoding spreadsheet logic. Reading a complex Excel formula is usually less about memorizing syntax and more about understanding structure to optimize your data analytics strategy. The most effective approach is to work from the outside in. Start by identifying the outermost function, because that top-level wrapper determines what the formula ultimately returns. Once you know whether the formula is centered around an IF, SUM, INDEX, MATCH, or another function, you can begin breaking the logic into smaller pieces.
Next, isolate the arguments passed into that outer function. In Excel, arguments are typically separated by commas at the highest level of nesting, so understanding where one logical branch ends and another begins is critical. From there, recursively inspect each nested function call using the same process. Instead of thinking purely in spreadsheet syntax, translate each section into business meaning. For example, rather than describing a segment as “a VLOOKUP wrapped in IFERROR,” frame it as “retrieve a customer discount rate and return zero if the lookup fails.”
As formulas grow more complicated, certain readability traps tend to appear repeatedly. Hardcoded constants like 0.15 or 1000 often indicate undocumented business assumptions hidden directly inside the logic. Deep nesting beyond two or three levels makes evaluation order difficult to follow and significantly increases maintenance risk. Unclear references, such as Sheet3!$AB$47 without named ranges or descriptive labels, force readers to constantly jump between tabs to reconstruct context. Recognizing these patterns early helps distinguish between formulas that are merely complex and formulas that are fundamentally fragile.
Worked example: decoding a nested IF with VLOOKUP
In this section, we’ll explore how we can decode a complex nested IF formula. Here’s the formula:
=IF(VLOOKUP(A2,Tiers,2,FALSE)="Gold",B20.15,IF(VLOOKUP(A2,Tiers,2,FALSE)="Silver",B20.10,B2*0.05))We can proceed by breaking the formula into labeled chunks:
- Outer function: IF(condition, value_if_true, value_if_false).
- Condition:
VLOOKUP(A2,Tiers,2,FALSE)="Gold". This looks up the customer in A2 against a Tiers table and checks whether their tier equals "Gold". - Value if true: B2*0.15. Multiply the order amount in B2 by 15%.
- Value if false: Another IF, this time checking for "Silver" and applying 10%, otherwise applying 5%.
Here’s the translation to plain language: "Look up this customer's tier. If they are Gold, give them a 15% discount on the order amount. If they are Silver, give 10%. Otherwise, give 5%." One-sentence summary: This formula calculates a tiered discount based on the customer's loyalty tier.
That is a clean explain Excel formula moment. You’d have noticed that the VLOOKUP is duplicated, the percentages are hardcoded, and adding a new tier means editing the formula in every cell that uses it. Yes, the formula works. However, it becomes a problem when scalability and repeatability are taken into account. With Quadratic, you can create scalable workflows using spreadsheet formulas, Python, and AI, all without having technical knowledge.
When to simplify or rewrite a formula
Some formulas are complicated because the business logic itself is complicated. Traditional spreadsheets like Excel and Google Sheets are difficult to maintain because the logic evolves without refactoring. A strong warning sign is excessive nesting, especially long chains of nested IF statements that are difficult to trace mentally. When the same calculation is duplicated in several places, even a small update introduces the risk that one copy gets modified while another is forgotten.”
Excel provides several ways to simplify these situations without fully rebuilding the model. Helper columns are often the fastest improvement because they break one opaque calculation into smaller intermediate steps that can be inspected independently. Named ranges also improve readability dramatically. A formula referencing DiscountRate or RevenueThreshold is far easier to audit than one pointing to Sheet2!$B$47.
Modern Excel functions further reduce formula sprawl. The LET function allows you to assign reusable names to subexpressions directly inside a formula, eliminating duplication and improving performance. Similarly, IFS provides a cleaner alternative to deeply nested IF chains, while XLOOKUP replaces many brittle VLOOKUP patterns with more transparent lookup behavior and stronger error handling.
At a certain level of complexity, the better decision is not simplification but redesign. When business rules become deeply conditional, formulas stop being the ideal abstraction layer. Logic expressed through structured tables or reusable workflows. AI spreadsheet analysis streamlines this process by explaining what an existing formula does and helping you restructure the workflow into something more transparent and sustainable.
Auditing a formula for reliability, not just meaning
Once you understand what a formula is doing, the next step is determining whether it can actually be trusted. Comprehension and reliability are completely different problems. A formula may be perfectly understandable in plain English and still produce incorrect outputs or silently break when the underlying data changes.
A proper audit starts by checking the consistency of references and assumptions across the spreadsheet. One of the most common issues is inconsistent references where a single row accidentally points to a different column or dataset than the surrounding formulas. Reference locking must also be examined carefully to ensure absolute references are used where formulas are copied across ranges, while relative references are allowed to shift appropriately.
Lookup behavior and repeated logic also deserve close attention during the audit process. If a lookup fails, the resulting output should be intentional and clearly understood rather than silently defaulting to misleading fallback values. Repeated subexpressions are especially dangerous because they create multiple copies of the same logic that can drift out of sync over time as different users edit different sections independently. Most Excel formula explainer workflows stop after interpretation, but the best data analysis tools depend on pushing beyond data processing into structured analysis and visualization.
How Quadratic fits: explain, analyze, and visualize in one place
Quadratic is an AI-powered spreadsheet that supports this full workflow in a single browser-based environment. It allows users to explain Excel formulas using AI, build repeatable workflows using Python, and visualize results seamlessly, all within the same environment. Let’s explore the features of Quadratic in detail.
Import inherited Excel models without losing the logic
One of the biggest challenges with complex spreadsheets is onboarding into workbooks you did not create. Financial models and reporting sheets often accumulate years of nested formulas and undocumented business logic. Quadratic makes this transition significantly easier by allowing users to import existing .xlsx files directly into a browser-based workspace while preserving formulas, references, and spreadsheet structure.
Instead of rebuilding the workbook from scratch or manually tracing formulas across tabs, you can immediately begin inspecting and interacting with the existing logic. This creates a much smoother workflow for analysts inheriting legacy Excel models, especially when working with forecasting templates, financial reporting sheets, or operational dashboards.
Simplify brittle spreadsheet logic with cleaner formulas
Many spreadsheets become difficult to maintain because formulas evolve organically over time. Quadratic helps users modernize these workflows by using AI to suggest cleaner and more maintainable formula structures directly within the spreadsheet.
For example, a workbook filled with deeply nested IF statements can often be rewritten using more structured lookup logic, reusable helper columns, or clearer conditional patterns. These explanations and rewrites live directly beside the original data and formulas, so users can compare versions transparently and validate improvements before replacing existing logic.
Replace formula sprawl with Python where appropriate
Some spreadsheet workflows eventually outgrow traditional formulas entirely. Complex categorization rules, advanced data modeling, or large-scale data transformation can become difficult to manage using formulas alone. Quadratic bridges this gap by supporting native Python and SQL execution directly inside the spreadsheet grid.
Instead of forcing increasingly complicated formulas into cells, users can move specific workflows into readable Python scripts while still keeping the logic tightly integrated with the spreadsheet. This is especially useful for data cleaning, financial forecasting, or data visualization workflows that would otherwise require external BI tools or scripting environments.
Use AI to explain formulas in plain language
Traditional spreadsheet debugging often involves manually stepping through formulas cell by cell, trying to decode deeply nested IF, INDEX MATCH, XLOOKUP, or array logic. Quadratic simplifies this process with built-in AI agents for data analysis that can explain individual formulas or even the purpose of an entire worksheet in plain language.
Instead of reverse-engineering a complicated formula structure yourself, you can have your Excel formula explained using AI. Additionally, you can ask Quadratic AI to break down what each component is doing, explain how referenced cells interact, and identify the business logic behind the calculation. This reduces the time required to understand inherited spreadsheets while improving confidence in the underlying model.
Let’s see how this works using the nested formula from our example:
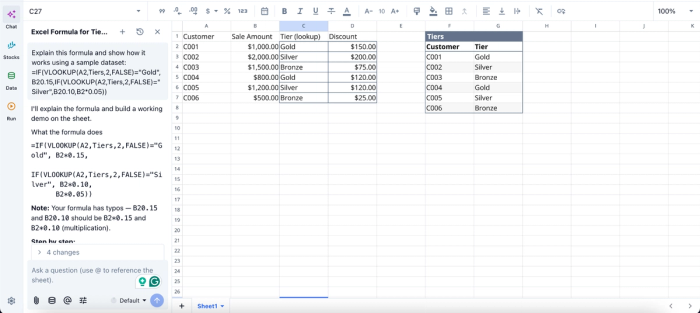
In this image, I prompt Quadratic AI, “Explain this formula and show how it works using a sample dataset.” In seconds, it gives a detailed step-by-step explanation of the formula and generates a table that shows a practical usage for better understanding.
Visualize spreadsheet outputs without exporting data elsewhere
Once formulas are cleaned and structured properly, the next challenge is interpreting the outputs effectively. Quadratic allows users to build different charts, dashboards, and visual summaries directly on top of spreadsheet calculations without exporting data into separate BI tools.
Whether you are analyzing financial forecasts or scenario modeling outputs, you can create live visualizations directly beside the underlying formulas and logic. This makes spreadsheet analysis far more contextual and easier to validate during reviews. Visualizations in Quadratic can also be done using text prompts:
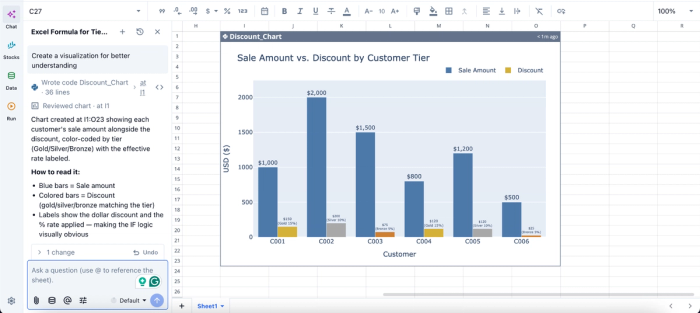
In this image, I simply ask Quadratic AI to “Create a visualization for better understanding.” In seconds, it creates a discount chart that shows the sale amount and discount by customer tier. Users can create interactive and dynamic visualizations by using text prompts.
Collaborate on spreadsheet rebuilding in real time
Modern spreadsheet workflows are rarely isolated to a single person. Finance teams, operations teams, and managers often need to review formulas and refine calculations together. Quadratic enables real-time collaboration directly inside the spreadsheet environment, allowing teams to inspect and improve models collectively.
The formulas, explanations, code, charts, and data remain centralized, so teams avoid the confusion caused by emailing spreadsheet versions back and forth. Everyone works from the same live environment, making reviews significantly faster.
Export back to Excel or evolve beyond traditional spreadsheets
Not every workflow can immediately leave the Excel ecosystem, especially in organizations with deeply embedded spreadsheet processes. Quadratic supports this reality by allowing rebuilt and simplified models to be exported back into Excel when needed.
At the same time, the platform provides a path toward more scalable and transparent workflows by combining spreadsheets with AI, Python, SQL, and collaborative analysis in one environment. This enables teams to move beyond simply understanding formulas toward building spreadsheet systems that are easier to trust, maintain, and evolve.
Conclusion
Decoding a formula is the start of the work, not the finish. An Excel formula explainer that translates syntax into plain English is useful, but the real outcome is a sheet you can trust, hand off, and extend without rebuilding from scratch. That means moving past explanation into auditing and rewriting in a cleaner form.
Quadratic allows you to import your Excel spreadsheet into a familiar environment where you can use AI to explain formulas, clean up logic, and rebuild confusing sheets into something easier to trust. Try Quadratic for free.
Frequently asked questions (FAQs)
How do I get Excel to explain a formula to me?
Excel's built-in Evaluate Formula feature steps through a formula one operation at a time, showing how each piece resolves. That is useful for tracing calculation order, but it does not translate the formula into plain English. For a faster path to understanding inherited formulas, especially in unfamiliar files, AI-based tools like Quadratic that read your spreadsheet and describe what each formula is doing in business terms are more practical than Excel's native mechanics-focused tools.
Can Quadratic AI explain Excel formulas accurately?
Yes. Quadratic AI handles nested IFs, lookup chains, lookup-and-aggregate combinations, and array formulas well, and it can flag fragile patterns like hardcoded values and duplicate subexpressions at the same time. It sees the formula and underlying data in the same environment, which is why it can explain formulas and suggest cleaner rewrites in one pass.
What should I do after explaining a formula?
Explanation is only the first step. After you understand what a formula does, audit it for reliability by checking for hardcoded values and edge-case handling. Then decide whether to simplify it using native Excel tools like LET and IFS, or replace it with cleaner logic. Quadratic streamlines this full workflow by letting you explain, audit, and rebuild formulas all in one browser-based environment, so the logic and its documentation stay together for the next person who inherits the sheet.