
James Amoo, Community Partner
Jun 1, 2026

For decades, analysts and finance teams have stretched spreadsheets well past their original design. Formulas grew into nested labyrinths that practically require an Excel formula explainer to decode, VBA macros propped up reporting workflows that nobody wanted to touch, and "just one more tab" became the unofficial motto of every quarterly model. The demand for Python in Excel did not appear out of nowhere. It came from a long-running gap between what spreadsheets ask people to do and what formulas and VBA can reasonably support.
Using Excel with Python closes the gap in ways formulas cannot: with statsmodels and scikit-learn, predictive modeling and analytics stop being approximations cobbled together from LINEST and TREND. Python data visualization libraries like Matplotlib and seaborn produce visualizations that go far beyond stock chart types. And because Python is a real programming language, the logic behind a model becomes readable, testable, and reusable rather than buried in cell references.
For finance teams in particular, the appeal of Excel and Python working together for financial data analytics is concrete: live data prep, more rigorous forecasting, reproducible financial reporting, and a path away from brittle macros. The question is no longer whether Python and Excel belong in the same workflow. It is how that combination should actually be built.
What is Python in Excel?
Python in Excel is Microsoft's feature that lets users write Python code directly inside Excel cells using the a =PY() function. The Python you write runs against your workbook data, and the results are returned to the grid. It ships with a curated set of libraries, including pandas for Excel users, NumPy, Matplotlib, seaborn, and statsmodels, so analysts can do real data work without leaving the spreadsheet.
It is aimed squarely at the audience that has been asking for it: Excel-native analysts, finance professionals, and business users who want more analytical horsepower without rebuilding their workflows in a notebook or IDE.
To enable Python in Excel, users need a qualifying Microsoft 365 subscription and a recent build of Excel on a supported channel. The feature is rolled out through Microsoft's update channels, and once available, the =PY() entry point appears alongside standard formulas. The exact availability and licensing details shift over time, so the practical answer to how to enable Python in Excel is to check that your Microsoft 365 plan and Excel build are current.
Whatever its limits, this is genuine progress. For a tool whose main spreadsheet automation story has been VBA for the better part of three decades, opening the cell up to a well-supported language is a meaningful change.
Where Python in Excel gets structurally awkward
The friction with using Python in Excel is about architecture. Python is being layered onto a grid that was designed in the 1980s for declarative formulas recalculated through a dependency graph on a single machine. When you introduce an imperative language into that model, the mismatch becomes visible. The spreadsheet engine expects cell-level recomputation; Python expects a runtime environment with explicit control flow, state, and tooling. Those assumptions do not naturally align, and the result is a hybrid system where neither side fully behaves the way you would expect in a native environment.
The cloud sandbox also constrains execution: limited package availability, restricted system access, and no direct integration with local files or external services unless explicitly routed through the workbook. Even when Python returns correct results, there is a translation cost in deciding whether outputs should remain as Python objects or be spilled into Excel ranges, which downstream formulas then depend on. On top of that, the execution model mismatch forces you to reason about dependency graphs and row-wise recalculation in a way that is not natural to Python developers, while collaboration and reproducibility remain constrained by Microsoft 365 dependencies and limited version-control visibility.
This is why the comparison with VBA is often misleading. Python in Excel is not a clean replacement layer; it is Python adapted to fit within an existing spreadsheet architecture that was never designed for it. That does not make it useless, but it does make it inherently constrained. A more coherent approach is to move the computation layer closer to a system designed for both code and grids.
That is where Quadratic fits in more naturally. It treats Python, SQL, formulas, and spreadsheet cells as coequal components of the same environment rather than layering one language awkwardly on top of another. The result is a workspace where code execution, data transformation, and spreadsheet analysis share the same native model, instead of constantly translating between incompatible ones.
Choosing between Python in Excel and a native Python spreadsheet
Choosing between Python in Excel and a native Python spreadsheet is less about feature comparison and more about identifying what role Python actually plays in your workflow. In some environments, Python is an augmentation layer sitting on top of an established Excel-centric process. In others, Python is the primary analytical interface, and the spreadsheet is simply the visualization and collaboration surface. Those are materially different operating models, even if they look similar at a glance.
Python in Excel fits best when teams are already standardized on Microsoft 365, and Excel is the canonical artifact for reporting and delivery. It works well when Python is used occasionally to extend formula logic or perform specific analytical tasks, while most of the workbook remains formula-driven. It also assumes that the data being analyzed already lives inside the workbook or can be easily brought into it, and that the available sandboxed libraries are sufficient for the job at hand.
A native Python alternative to Excel is the better fit when Python is not an add-on, but the default way analysis is done. In that model, live connections to databases, APIs, and external systems are not edge cases but core requirements, and reproducibility, inspectability, and collaboration across technical and non-technical users are built into the environment rather than layered on later. It also changes the data automation story, as scheduling, reuse, and AI-assisted analysis become part of the core surface instead of external tooling stitched on top.
In practice, many teams will operate in both ecosystems during a transition period. That is expected rather than problematic. The key decision is which architecture reflects how your work is actually produced and reused over time.
How to use Python in Excel using Quadratic
Quadratic is built around that native model, and is designed to function as a data science spreadsheet where Python, SQL, and AI share the same canvas. Python is a first-class language in the cell alongside SQL and formulas, so analysts write Python directly without a cloud sandbox round-trip and without translating results back into Excel ranges. Let’s explore the capabilities of Quadratic.
Build recurring analysis pipelines against live data
One of the biggest differences between native and layered architectures appears when data starts changing. In many-layered spreadsheet systems, Python workflows depend on manual exports or intermediary connectors that gradually become brittle over time.
Quadratic treats live data connectivity as part of the spreadsheet surface. It provides direct connection to Postgres, MySQL, Snowflake, Supabase, APIs, and uploaded files from inside the same browser-based workspace. Once connected, Python can query, clean, reshape, and model the data without leaving the sheet.
That matters for real operational workflows. A finance team can pull monthly revenue data directly from a warehouse, run cohort analysis in Python, calculate retention metrics with formulas, and generate financial data visualization in one refresh cycle. An operations team can ingest CSV exports from multiple systems and rebuild an accounting dashboard automatically each reporting period.
SQL, formulas, and Python working together in one model
Most real spreadsheet workflows are hybrid workflows. Some calculations belong in formulas. Some belong in SQL, prompting many to search for ways to use SQL in Excel. Some require Python. Problems emerge when each layer lives in a separate tool with separate execution contexts.
Quadratic combines all three directly in the same canvas. A connected SQL query can pull transactional data into the spreadsheet, formulas can handle lightweight business logic, and Python can perform heavier predictive analytics or transformation work without moving data across systems.
That architecture maps more naturally to how analysts actually work. A finance analyst might use SQL to aggregate transactions, formulas to model commission logic, and Python to run forecasting or scenario analysis. In a layered environment, each step would likely require a different tool, such as configuring a way to connect Excel to SQL Server. In Quadratic, the entire workflow remains visible in one place.
AI-assisted Python workflows inside the spreadsheet
Quadratic also changes the accessibility story around Python in spreadsheets through embedded AI assistance. Instead of forcing analysts to write every transformation manually, the AI can generate Python directly into cells based on natural language instructions.
An analyst might ask the AI to calculate rolling averages, detect outliers, build a forecast model, or reshape nested JSON data from an API response. The generated Python appears directly in the sheet where it can be inspected and rerun.
This becomes especially useful in mixed-skill teams. Spreadsheet-native users can start workflows conversationally, while more technical users can refine the generated Python into production-quality logic. The AI accelerates development without turning the spreadsheet into a black box. Let’s see an example.
First, I connect to my financial dataset using Quadratic’s Plaid integration:
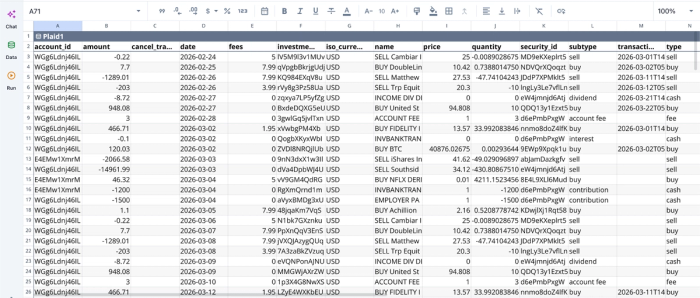
After successfully connecting to my data, I can immediately begin analysis:
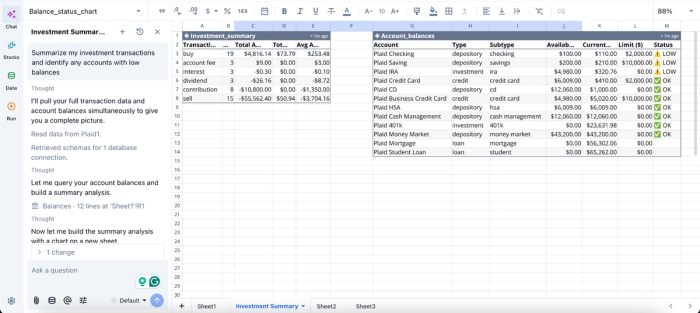
In this image, I ask Quadratic to “Summarize my investment transactions and identify any accounts with low balances,” which is a great starting point for a personal finance dashboard. It instantly creates two tables: one that shows a summary of my investment, and another that gives insights into my accounts with low balances.
Data visualization that stays connected to the model
In layered architectures, charts are often downstream artifacts disconnected from the transformation logic that created them. Once exported into slides or data visualization tools, the relationship between the analysis and the visualization becomes fragile.
Quadratic keeps visualizations inside the same computational surface as the data and Python code driving them, making building Excel dashboards much more seamless. A dataframe produced in Python can feed directly into charts and dashboards without additional export steps or synchronization layers.
This is particularly valuable for recurring analytics workflows. A revenue forecast chart, operational KPI tracking dashboard, or retention cohort visualization updates automatically as the underlying data refreshes and the Python cells rerun. Analysts are not rebuilding charts manually every reporting cycle.
Visualization in Quadratic can also be done using text prompts. Here’s an example:
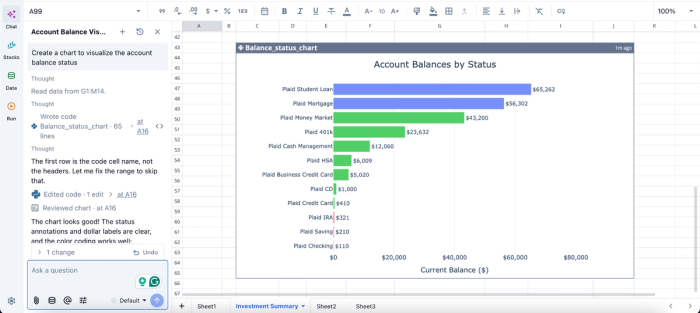
In this image, I ask Quadratic to “Create a chart to visualize the account balance status.” In seconds, it creates a chart that shows the account balance by status.
Collaboration without runtime fragmentation
Layered Python spreadsheet systems often create collaboration problems because only certain users can execute the code layer correctly. One user may have access to the runtime while another only sees static outputs. Reproducibility becomes dependent on subscriptions, desktop installations, or environment setup.
Quadratic avoids that fragmentation through a multiplayer architecture. Everyone works against the same live sheet, with the same Python cells, formulas, SQL queries, and charts visible in real time.
That changes how spreadsheet collaboration works for technical workflows. A data analyst can build a Python-powered forecasting model while a finance stakeholder reviews outputs in the same environment. An operations manager can inspect the formulas and charts without needing to reconstruct the underlying pipeline elsewhere or ask someone to explain Excel spreadsheet logic.
Conclusion: what should a spreadsheet for code look like?
Python in Excel is a real step forward, and it deserves credit for that, though teams doing code-first work may find a stronger alternative to Excel in environments designed for it from the ground up. It validates a demand that analysts and finance teams have been signaling for years: formulas alone are not enough for modern analysis.
Quadratic streamlines this workflow by providing a native coding spreadsheet that supports Python, SQL, and JavaScript right within the spreadsheet. Try Quadratic for free.
Frequently asked questions (FAQs)
How do you enable Python in Excel?
To enable Python in Excel, you need a qualifying Microsoft 365 subscription and a recent build of Excel on a supported update channel. Once available in your environment, you can start a Python cell with =PY( and write Python code directly. Check Microsoft's current documentation for your specific plan, as availability shifts over time.
Does Python in Excel run locally or in the cloud?
Python in Excel runs in the cloud on Microsoft-hosted containers, not on your local machine. This means you need an internet connection for Python cells to evaluate, and the runtime is sandboxed with a fixed library set and restricted access to local files and external systems.
How does Quadratic approach Python in a spreadsheet differently?
Quadratic is built as a native Python spreadsheet where Python runs as a first-class language in the cell without a cloud sandbox round-trip. Python executes directly in the application, so you get live data connections to databases, APIs, and files without latency or connectivity requirements. Dataframes and charts display natively in cells, and code is editable and inspectable as part of the spreadsheet, not wrapped in a formula.