
James Amoo, Community Partner
Jun 1, 2026

Table of contents
- Before you start: what you'll need
- How to connect Microsoft SQL Server to Excel using Power Query
- How to connect Excel to SQL Server using an ODBC connection
- The limits of Excel's SQL Server connection
- A spreadsheet-native alternative: connecting SQL Server directly in Quadratic
- Conclusion and next step
- Frequently asked questions (FAQs)
Can Excel connect to SQL Server? The answer is yes, and there is more than one way to do it. The commonly supported paths are Power Query (built into Excel) and an ODBC driver connection. Both let you pull live data from a SQL Server database into a worksheet, refresh it on demand, and shape it before it lands in the grid.
Older approaches using VBA and ADO still exist, but they fall outside most current analyst workflows, and we will not cover them in depth here. Instead, we’ll be covering a better and more seamless approach than Power Query and ODBC for connecting Excel to SQL Server.
This article walks through the traditional methods step by step, covers refresh and connection management, and then discusses where connecting Excel to SQL Server starts to break down. By the end, you will have a clear sense of the best approach to use for connecting Excel to SQL Server database.
Before you start: what you'll need
Before you connect to SQL Server from Excel, gather a few things so the setup goes smoothly:
- The SQL Server instance name (for example, server.company.com or SERVER\INSTANCE) and the target database name.
- Authentication credentials, either Windows authentication or a SQL Server username and password.
- Network access to the server, including any required VPN connection or firewall allowances.
- A supported Excel version. Power Query is built into Excel 2016 and later; earlier versions require the Power Query add-in.
- The Microsoft ODBC Driver for SQL Server is installed on your machine if you plan to use the ODBC route.
- Read permissions on the tables, views, or stored procedures you plan to query.
A few minutes of preparation here will save you from chasing credential and permission errors later.
How to connect Microsoft SQL Server to Excel using Power Query
Power Query is the most direct way of connecting Excel to SQL Server for most analysts, though understanding SQL for data analysis more broadly will help you write better custom queries and interpret results correctly. It is GUI-driven, supports query folding back to the server, and creates a refreshable connection you can reuse.
Here is the step-by-step setup:
- In Excel, go to Data > Get Data > From Database > From SQL Server Database.
- Enter the server name. Optionally enter the database name as well. Choose Import to load a snapshot into the workbook, or DirectQuery if your version supports it and you want queries to remain live against the source.
- Authenticate. Most environments use Windows credentials, but SQL Server authentication with a username and password is also supported.
- In the Navigator pane, browse the database and select the tables or views you want.
- Click Load to drop the data into a worksheet, or Transform Data to open the Power Query Editor and shape the result first.
The advantages are real: a clean interface, server-side query folding for many data transformations, and a saved connection that can be refreshed on demand or on a schedule.
How to connect Excel to SQL Server using an ODBC connection
ODBC is the older but still useful path. It is worth knowing if you maintain legacy workbooks, share DSN configurations across a team, or need compatibility with third-party tools.
- Install the Microsoft ODBC Driver for SQL Server if it is not already on your machine. Match the bitness to your Excel install (most modern Excel versions are 64-bit).
- Open the ODBC Data Source Administrator (64-bit) from Windows. Under the System DSN or User DSN tab, click Add and select the SQL Server driver.
- Configure the DSN: give it a name, enter the server, choose Windows or SQL Server authentication, and set a default database.
- Use the Test Data Source button at the end of the wizard to confirm the connection works.
- In Excel, go to Data > Get Data > From Other Sources > From ODBC, then select your DSN. From there, you can browse tables or write a custom database query statement.
When is ODBC preferable for connecting Excel to a SQL Server database? Mostly in three situations: you are maintaining workflows that already depend on a DSN, you want a centrally managed connection definition that multiple workbooks share, or you need ODBC for compatibility with another tool in the chain.
The limits of Excel's SQL Server connection
Power Query and ODBC do their jobs well for individual analysts working at a modest scale. But there are real ceilings worth naming before you build a workflow you will regret. Excel's worksheet limit of 1,048,576 rows is the obvious one, though practical slowdowns usually appear much earlier.
Sorting, pivoting, recalculating formulas, and refreshing live connections become noticeably slower once workbooks grow into the hundreds of thousands of rows. At that point, analysts often spend as much time waiting for refreshes and recalculations as they do interpreting the data itself.
The operational friction compounds from there. Refreshes are fragile because they depend on credentials, drivers, VPN connections, server availability, and local configuration. A rotated password or a dropped connection can break an entire reporting flow, and the resulting error messages are rarely clear enough to diagnose quickly.
Collaboration also becomes awkward. Workbooks with embedded SQL connections and Power Query pipelines do not behave gracefully in multi-user environments. Co-authoring exists, but mixing concurrent editing with live refreshes introduces conflicts and inconsistent outputs. Version drift becomes inevitable once files are copied into email threads or shared drives, because every recipient ends up working from a slightly different snapshot with different refresh states and filters applied.
Quadratic offers a more integrated approach by supporting SQL, Python, formulas, charts, and AI-assisted analysis directly inside a collaborative spreadsheet environment. Instead of treating SQL as an external import pipeline bolted onto a workbook, Quadratic keeps queries and outputs visible in the grid itself, making the logic easier to inspect, share, and maintain across a team.
A spreadsheet-native alternative: connecting SQL Server directly in Quadratic
If you have hit those thresholds but still want a spreadsheet interface, Quadratic is built for exactly this case, offering direct spreadsheet integrations with databases including SQL Server, Postgres, Snowflake, and more.
Replace refresh-heavy Excel workbooks with direct connected analysis
Traditional Excel-to-database workflows often accumulate layers of fragility over time. Refresh paths break, local connections drift between users, and analysts lose confidence that everyone is looking at the same version of the data.
Quadratic removes much of that operational friction by treating live database connectivity as a native spreadsheet capability instead of an external integration layer. SQL query outputs stay attached to the workbook itself and can be rerun directly against the current database state.
An operations analyst tracking customer support metrics, for example, can connect directly to SQL Server tables containing tickets, SLA data, and resolution timestamps. The analysis updates from the source instead of relying on yesterday's CSV export sitting on someone's desktop.
Combine SQL, Python, and formulas in the same workflow
One of the biggest limitations in traditional Excel database workflows is that every analytical layer lives somewhere different. SQL retrieval happens in one tool, transformations in another, and visualization in yet another.
Quadratic unifies those layers inside one spreadsheet canvas. SQL retrieves the data, Python handles data cleaning or transformation, and formulas manage lightweight spreadsheet calculations directly beside the outputs.
A revenue analytics workflow might start with a SQL query that pulls transactional data from SQL Server, continue with pandas-based cohort analysis in Python, and end with spreadsheet KPI tracking and charts that feed an executive dashboard. All of that logic remains visible in the same file.
Use AI to generate and explain SQL analysis inline
Many analysts understand the business question they want answered long before they remember the exact SQL syntax required to produce it. That gap often slows exploratory analysis and increases reliance on technical specialists for relatively straightforward reporting tasks.
Quadratic integrates AI directly into the spreadsheet workflow so analysts can describe what they want in plain language and generate SQL directly in the sheet. The important distinction is that the generated query becomes visible and editable spreadsheet logic, not a hidden chatbot response.
An analyst could ask the AI to compare quarter-over-quarter revenue growth, identify customers with declining retention, or segment support tickets by escalation patterns. The resulting SQL appears directly in a cell where it can be reviewed and shared with teammates.
Let’s see how this works using a sample Excel dataset:
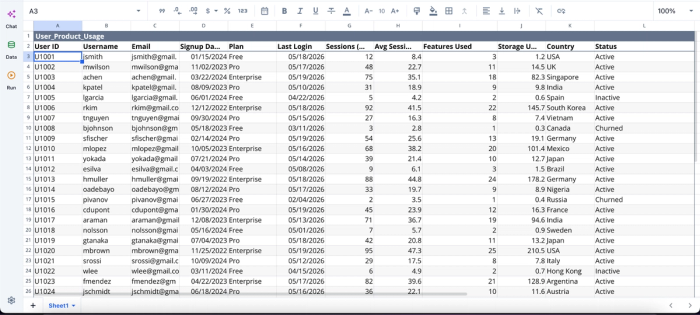
After importing my Excel data into Quadratic AI, I can immediately begin analysis:
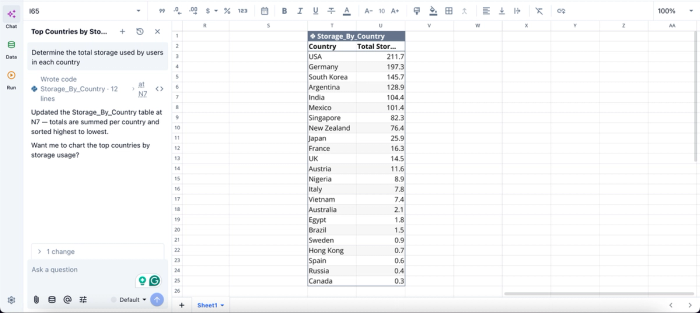
In this image, I ask Quadratic AI to “Determine the total storage used by users in each country.” It instantly creates a table that shows the total storage used by each country.
Build dashboards directly from connected SQL Server data
A common pain point in Excel reporting is the gap between querying data and presenting it visually. Analysts frequently export results from SQL Server, reformat them manually, and rebuild charts every reporting cycle.
Quadratic keeps the querying and visualization layers tightly connected. SQL outputs flow directly into spreadsheet-native charts, summary tables, and dashboards without requiring a separate BI tool.
A customer success team could query churn metrics from SQL Server, generate retention segments with Python, and create visual dashboards directly beside the underlying data tables. Refreshing the query updates the downstream visualizations automatically.
Here’s how we can generate dynamic visualizations from our dataset using text prompts:
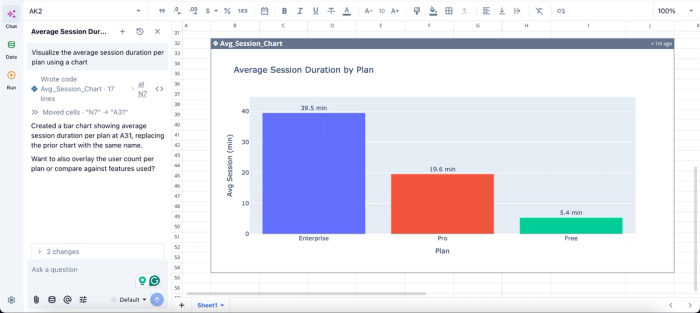
In this image, I ask Quadratic AI to “Visualize the average session duration per plan using a chart.” In seconds, it creates a chart that displays the average session duration by plan.
Collaborate on live analytical models instead of spreadsheet copies
Database-connected Excel workflows often fail operationally at the collaboration layer. Analysts email workbook copies back and forth, refreshes happen on different schedules, and nobody is entirely sure whose numbers are current.
Quadratic is browser-based with real-time collaboration, which means teams work against the same live spreadsheet connected to the same underlying SQL Server data source.
A sales operations manager reviewing forecasts can inspect the same dashboard that an analyst is updating in real time. A data engineer can validate the SQL query powering a metric while finance stakeholders review the financial reporting data generated from it. The analytical surface and the collaboration surface remain unified.
.
Conclusion and next step
This blog post has satisfactorily answered the “Can Excel connect to SQL Server” question. Power Query and ODBC are the right tools when a single analyst needs to connect Excel to a SQL Server database on a modest scale. They are well-supported and good enough for many recurring reports.
The picture changes when datasets grow, and more analysts need to collaborate on the same source. At that point, the friction of maintaining Excel connections starts to outweigh the convenience of staying in a familiar interface, and a spreadsheet built for direct database access becomes the smarter fit. This is where Quadratic comes in.
Quadratic allows you to connect SQL Server directly to Quadratic and analyze live data in a spreadsheet without export-heavy Excel workflows. Using simple text prompts, you can also leverage AI to generate analysis and visualization directly from your SQL Server data. Try Quadratic for free.
Frequently asked questions (FAQs)
Does connecting Excel to SQL Server require Microsoft 365?
No. Power Query is built into Excel 2016 and later; earlier versions require the Power Query add-in. Older versions can also use ODBC as an alternative method for connecting Excel to SQL Server.
What's the difference between Import and DirectQuery in Excel?
Import loads a snapshot of the data into the workbook, which you then refresh on demand. DirectQuery, where supported, keeps queries live against the source so each interaction hits the server, reducing staleness but adding latency and load on the database.
How does Quadratic help when Excel's SQL Server connection limits become a problem?
Quadratic lets you write SQL directly in spreadsheet cells and see results populate live in the grid without the export-and-refresh cycle. You can combine SQL queries with Python and formulas in one canvas, collaborate with multiple analysts in real time, and handle datasets far larger than Excel's row limits.