
James Amoo, Community Partner
Jun 1, 2026

Table of contents
If you've ever tried to build a personal finance dashboard, you've probably hit the same wall most people do. You end up choosing between spreadsheet automation and flexibility. Budgeting apps connect to your accounts and pull in transactions automatically, but they lock you into their categories and their idea of what your financial life should look like. Spreadsheets give you total flexibility, but they demand constant manual upkeep, and the moment you stop exporting CSVs, your dashboard depends on stale data.
Neither approach, on its own, gives you what you actually want: a clear view of your spending, income, cash flow, debt, investments, and net worth that updates on its own and bends to how you think about money.
Quadratic combines a collaborative spreadsheet interface with live financial data connections via its Plaid integration. It allows users to leverage AI-assisted analysis, Python, SQL, and charting in the same environment. Instead of manually exporting CSVs into static spreadsheets or being locked into a budgeting app's predefined structure, you can build a dashboard that updates automatically while remaining fully customizable and inspectable.
The best personal finance dashboard resolves the tension instead of forcing you to pick a side. It combines live financial data with a spreadsheet layer you actually control, so you get the automation of an app and the flexibility of a custom build. That's the approach this guide walks through.
Budgeting apps vs. spreadsheets: where each falls short
Budgeting apps have real strengths. They connect to your bank, credit card, and brokerage accounts, pull transactions automatically, and serve up a clean mobile interface. Most apply some level of auto-categorization out of the box, so you get a usable view of spending within minutes.
If you've been weighing a budget app or spreadsheet and struggling to choose, the trade-offs show up quickly once you start using either one. Categories are typically preset and only loosely customizable. Views are fixed. Anything beyond the basics tends to sit behind a paywall. And your data lives inside their system, which means you're limited to whatever charts, filters, and KPIs the app has decided to build.
The breakpoints are predictable. Merged or duplicated transactions become difficult to clean up, certain account types like HSAs, niche brokerages, or manual assets such as real estate are not fully supported, and there is little room for custom KPIs tracking. Over time, the financial reporting layer also becomes limiting because the app summarizes what it thinks matters instead of reflecting the metrics and financial views you actually care about.
What spreadsheets get right and where they fail
A traditional Excel personal finance dashboard goes the other direction. You get full ownership and total flexibility. You define the categories, write the formulas, build the views, and decide exactly how each number is calculated. For spreadsheet-comfortable users, this is the appeal.
The cost is upkeep. A personal finance dashboard in Excel almost always relies on manual CSV exports from each bank and card. That works for a week or two. Then life happens, you skip an export, and your dashboard quietly drifts out of date. Categorization fatigue sets in. Formulas break when column orders change. The dashboard you spent a Saturday building turns into a graveyard tab you stop opening.
This is the core problem with the traditional personal finance dashboard Excel approach. The build is great, but the maintenance is brutal.
The case for a hybrid workflow
The best personal finance dashboard is the one that pairs synced live data with a spreadsheet layer you control. You get the automatic transaction feed of an app, plus the formulas, custom categories, and bespoke views of a spreadsheet. No CSV exports. No vendor lock-in on how your data gets sliced.
The rest of this article walks through what that dashboard should include, where categorization tends to break, and how Quadratic streamlines the entire process.
The five views every personal finance dashboard should include
Most dashboards fail because they try to show everything at once. A better approach is to commit to five core views, each answering a specific question. Together, they cover the full picture without bloat.
1. Cash flow
A cash flow calendar tracks income in versus expenses out across a rolling window, usually the last 30, 60, or 90 days. If you want a ready-made starting point, the cash flow analysis dashboard recipe in Quadratic builds this view automatically from your connected accounts. It's more useful than a static monthly budget or a 50 30 20 calculator because it reflects how money actually moves through your life rather than how you planned for it to move.
Useful visuals here include a monthly bar chart of income vs. expenses and a running balance line that shows your trajectory. If you only look at one view regularly, this is it.
2. Spending
Spending is where most people start, and where most apps stop. The ability to analyze credit card spending at the merchant level is where a custom dashboard pulls ahead. A good category spend analysis shows category breakdowns, merchant-level detail, and month-over-month comparisons.
The win comes from customization. This involves defining the categories that match how you actually think about money (separating "groceries" from "restaurants" from "coffee," for example), and being able to drill from a category down to the specific transactions that drove it.
3. Balances
This view acts as a bank account tracker, providing a single snapshot of every account you have: checking, savings, credit cards, loans, and brokerage. Building a live bank account balance spreadsheet that refreshes automatically is one of the highest-value pieces of a personal finance dashboard. This is harder to get than it sounds. Most apps cover some account types well and others poorly. A unified balances view is one of the highest-value pieces of a personal finance dashboard and one of the things people most often build a custom solution to get.
4. Net worth
Net worth is assets minus liabilities, tracked over time. A net worth calculator that pulls from live account balances removes the manual work of keeping this number current. It's the single best long-term KPI in personal finance because it captures the combined effect of saving, investing, and paying down debt in one number. A simple monthly snapshot tells you whether you're moving in the right direction, regardless of what any single month's spending looked like.
5. Goals
Goals turn the dashboard from a rearview mirror into something forward-looking. Savings targets, debt payoff timelines, emergency fund progress, a sinking fund, and a down payment fund. Pick the handful that matter and tie progress directly to live account balances rather than entering numbers by hand. When your savings goal tracker updates automatically as your accounts move, you'll actually trust it.
Where transaction categorization breaks down
Auto-categorization is the feature that makes finance apps feel magical for the first week and frustrating after the first month. It tends to break down in predictable places. Ambiguous merchants where a generic “SQ *” Square charge could represent almost anything, transfers between your own accounts being misclassified as income or spending, and transactions that should realistically be split across multiple categories.
On top of that, the preset categories from any given app rarely match how you actually think about your spending. You might care deeply about distinguishing "weekday lunch" from "weekend dining out." No app's taxonomy will match yours exactly.
The hybrid approach handles this better. Start with a set of rules to handle the obvious cases, override manually for the edge cases, and refine your rules over time as patterns emerge. A spreadsheet layer with formulas, or with AI to suggest categories based on merchant text, can close most of the remaining gap.
Quadratic: the best personal finance dashboard
Quadratic changes the workflow by turning the spreadsheet into a live financial environment rather than a static budgeting file. Through financial API integration like Plaid, bank accounts, credit cards, and brokerage balances can sync directly into the sheet automatically. Let’s explore the features of Quadratic in detail.
Connect multiple financial sources into one unified workspace
Personal finance rarely lives in one account anymore. Income, investments, savings, debt, subscriptions, brokerage balances, and side-business cash flow often exist across multiple platforms simultaneously.
Quadratic allows those sources to coexist in one workspace via its Plaid integration. Transactions from checking accounts can sit alongside brokerage balances, recurring subscription tables, budgeting categories, and long-term forecasting models in the same file.
Track financial models with Python and SQL
Most personal finance apps assume everyone measures money the same way. Real financial workflows are usually more specific.
Some people care about discretionary spending velocity. Others track savings rate, debt payoff timing, investment allocation drift, runway projections, or business-versus-personal cash flow separation. Generic dashboards rarely support that level of customization cleanly.
Quadratic supports native Python and SQL directly in the same grid, allowing users to build finance models tailored to their own priorities. You can calculate rolling emergency fund coverage, forecast investment growth, simulate debt repayment strategies, estimate tax obligations, or build custom predictive analytics systems using live financial data.
A freelancer might calculate irregular income smoothing month by month. A household could track joint versus personal spending ratios. Someone pursuing financial independence might use a FIRE spreadsheet to model long-term portfolio growth under different savings assumptions.
Analyze recurring financial behavior automatically
One of the biggest advantages of AI-powered financial data analysis is behavioral pattern detection. Most people do not notice gradual spending drift until it compounds into a meaningful financial problem.
Quadratic can use AI and Python together to identify unusual transactions, surface spending anomalies, and summarize category-level trends over time.
A sudden increase in food delivery spending becomes visible automatically. A forgotten annual subscription can be flagged before renewal. Utility bills that drift outside historical ranges can trigger alerts directly inside the dashboard.
Analyze spending intelligently with AI
Personal finance data is messy in practice. Merchant names vary, subscriptions appear under inconsistent billing labels, and transaction feeds often arrive partially normalized at best.
Quadratic uses AI agents for data analysis directly inside the spreadsheet to help categorize bank transactions, identify recurring charges, and surface trends automatically. You can prompt the AI to group expenses into categories like groceries, utilities, travel, dining, or subscriptions, then refine the classification logic directly inside the grid.
The important distinction is visibility. The categorization logic does not disappear into a hidden recommendation engine. Formulas, Python transformations, and AI-generated mappings remain inspectable and editable directly in the spreadsheet. Let’s see how this works.
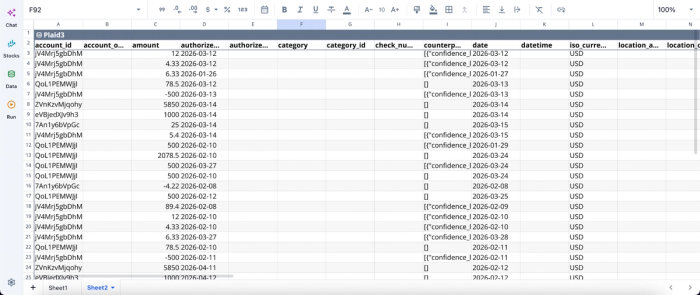
First, I connect to my bank account via Quadratic’s Plaid integration:
Then I can proceed to analysis using text prompts:
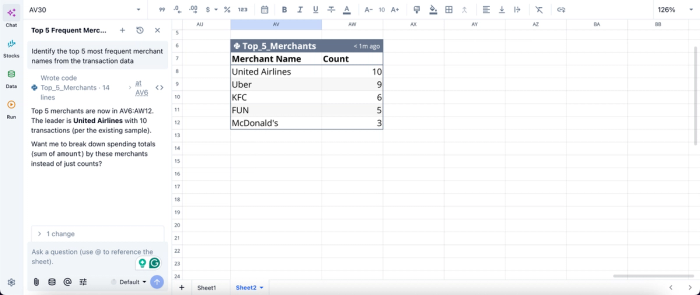
In this image, I ask Quadratic AI to “Identify the top 5 most frequent merchant names from the transaction data.” It instantly generates a table that shows the top 5 merchants. No code or formula required, just simple text prompts.
Build dashboards and visualizations directly in the sheet
Most spreadsheet finance workflows eventually hit a visualization bottleneck. The data exists, but turning it into readable charts and dashboards often requires another tool or extensive manual formatting.
Quadratic includes built-in charting and AI-assisted financial data visualization directly inside the same workspace. Users can generate spending breakdowns, savings trend charts, cash flow timelines, investment allocation visuals, debt reduction progress trackers, and recurring subscription dashboards without exporting data elsewhere.
A monthly spending chart updates automatically as new transactions sync into the sheet. A net worth dashboard recalculates in real time as balances change. A savings-rate graph evolves continuously without rebuilding formulas or chart ranges manually.
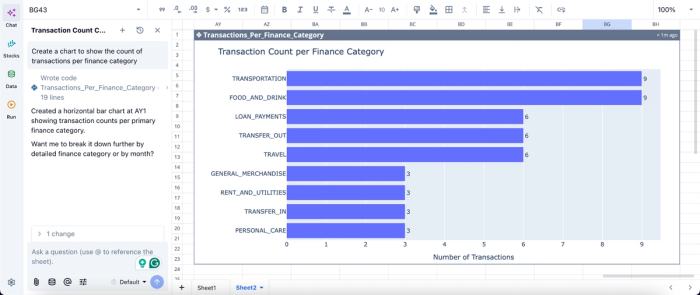
Visualization in Quadratic can also be done by using text prompts:
In this image, I ask Quadratic AI to “Create a chart to show the count of transactions per finance category.” In seconds, it creates a chart that displays the transaction count per finance category, helping non-technical users to interpret their data with ease.
Collaborate on household or shared financial planning
Financial planning is often collaborative. Couples manage shared budgets using a couples budget template, founders track operational spending together, and families coordinate savings goals across multiple contributors.
Quadratic’s browser-based collaboration model allows multiple people to work inside the same live financial dashboard simultaneously. One person can review spending categories while another updates forecasting assumptions or annotates unusual expenses directly in the sheet.
The shared visibility reduces confusion and eliminates the “latest spreadsheet version” problem common in traditional budgeting workflows. Logic, assumptions, and outputs remain attached to the same living document.
Build a dashboard that fits how you actually manage money
A good personal finance dashboard is a list of five clear views. cash flow, spending, balances, net worth, and goals in a layout that matches how you think. The reason most dashboards fail is that they force you to choose between automation and control. The hybrid approach gives you the best of both worlds. The best personal finance dashboard is the one you'll actually open, trust, and use to make decisions. That usually means building it yourself, with tools that do the tedious parts for you.
Quadratic allows you to connect your financial accounts directly to the grid and build a personal finance dashboard that fits how you actually manage money. Try Quadratic for free.
Frequently asked questions (FAQs)
What's the difference between a personal finance Excel dashboard and a budgeting app?
A budgeting app automates transaction collection but locks you into preset categories and fixed views, while a personal finance dashboard in Excel gives you full control but demands constant manual CSV exports to stay current.
How does Quadratic help build a personal finance dashboard?
Quadratic brings together the key pieces you need: a Plaid connection that syncs live bank, credit card, and brokerage data directly into your spreadsheet, native formulas and Python for custom categorization and calculations, and scheduled refreshes that keep your dashboard current automatically. You get the automation of a budgeting app with the customization of a spreadsheet, all in one browser-based workspace.
Is a free personal finance dashboard template worth using?
Free spreadsheet templates have a low upfront cost but high ongoing maintenance. You'll spend the savings in time exporting CSVs and manually updating data. A better measure is whether the dashboard stays current automatically. A tool that quietly refreshes in the background costs more upfront but saves time and stays trustworthy, making it cheaper in real terms than a free template you abandon after two months.