
James Amoo, Community Partner
Apr 30, 2026

Table of contents
- The risks of a manual Excel bank account balance spreadsheet
- Core components of a modern cash flow dashboard
- Static templates vs. automated financial workflows
- How to build an automated bank account balance spreadsheet
- Building a bank account balance spreadsheet in Quadratic
- Conclusion
- Frequently asked questions (FAQs)
Everyone wants a simple and unified view of their finances. But relying on manual data entry and data exploration increases the risk of stale data the moment you finish typing it. It is incredibly frustrating to build an accounting dashboard only to realize your cash position has already changed. Instead of clinging to static templates that demand constant updates, you can build an automated spreadsheet that provides real-time insights and deep cash flow context.
Quadratic stands out as the best tool for this approach, combining real-time data integration, spreadsheet flexibility, and AI-powered financial data analytics to help you build a truly dynamic and up-to-date bank account balance spreadsheet. This article covers the pitfalls of manual tracking, the essential components of a cash flow dashboard, and a step-by-step guide to building a live financial overview.
The risks of a manual Excel bank account balance spreadsheet
Managing your finances by hand introduces significant risk. When you manually log every transaction, human error is inevitable. A simple typo can throw off your entire financial reporting process, leading to hours spent hunting down missing pennies. Duplicate entries and timing differences between when a transaction occurs and when you record it will quickly skew your cash visibility.
While traditional spreadsheets like Excel and Google Sheets are a familiar starting point for many, it simply fails to scale. For busy individuals, growing SMBs, and finance teams, relying on manual data entry means making decisions based on delayed and potentially inaccurate information.
Another issue is the lack of real-time visibility. A manually updated spreadsheet cannot fully reflect your current financial position, which makes it difficult to confidently make time-sensitive decisions like approving expenses or managing short-term liquidity. This lag between reality and reporting introduces unnecessary financial risk.
Over time, the maintenance burden also compounds. As your financial activity increases, so does the complexity of your spreadsheet. What starts as a simple tracking tool can quickly evolve into a fragile system filled with interconnected formulas and manual processes. This not only consumes valuable time but also increases the likelihood of errors, making it harder to trust the very data you rely on for decision-making.
Core components of a modern cash flow dashboard
Regardless of the software you use, a reliable modern cash flow dashboard is built on a few foundational elements that ensure accuracy and clarity. The first is establishing precise beginning balances across all accounts. This serves as the baseline for every calculation that follows, ensuring that your cash position is grounded in reality from the start and that all inflows and outflows are properly reconciled. Quadratic enhances this step by allowing you to sync account data directly and automate data processing without manual intervention.
The second critical component is tracking expected inflows alongside categorized outflows. Monitoring incoming revenue enhances cash flow forecasting and allows you to plan with confidence. At the same time, grouping expenses into well-defined categories provides immediate visibility into spending patterns, helping you understand exactly where your money is going and identify areas for optimization. With Quadratic, you can automate transaction categorization, integrate multiple data sources, and even use Python-based logic to build more advanced forecasting models directly within your workflow.
When these components work together, they create a cohesive system that delivers a clear view of both your current cash position and predictive analytics trends. By focusing on structured transaction tracking and summarized insights, a well-designed dashboard enables more informed financial decisions while laying the groundwork for deeper analysis and long-term planning. Quadratic brings this all together in a unified environment, combining real-time data, dynamic visualizations, and flexible spreadsheet functionality to help you move from basic tracking to fully automated financial management.
Static templates vs. automated financial workflows
Standard finance templates often seem like a quick fix, but they come with a heavy administrative burden. They require you to constantly log into multiple bank portals, download and analyze CSV files, and then reformat the data to match your layout.
This repetitive cycle causes severe data lag. By transitioning to automated financial workflows, you eliminate the need for manual CSV exports. Automatically syncing your bank transactions removes repetitive tasks and ensures you are always looking at your true financial standing.
Beyond efficiency, automation also unlocks a higher level of analytical capability. With continuously updated data, you can build dynamic dashboards, run real-time cash flow forecasts, and set up rules that automatically categorize transactions or flag anomalies.
How to build an automated bank account balance spreadsheet
Transitioning from static data entry to a dynamic workflow changes how you interact with your financial data. Here is a step-by-step guide to building an automated bank account balance spreadsheet that does the heavy lifting for you.
Step 1: Connect your live bank data
The critical first step to achieving real-time financial visibility is bypassing manual CSV exports entirely. Instead, you should use secure API connections to pull live account balances and transaction details directly into your workspace. Modern financial setups rely on established financial data networks to bridge the gap between your bank and your spreadsheet. This ensures that your information is continuously synced in the background, giving you a live feed of your money without any manual intervention.
Step 2: Categorize and process transactions
Once your live data is flowing into your sheet, the next step is to organize those raw transactions into meaningful groups. You will want to define clear categories such as operational expenses, payroll, software subscriptions, or personal spending. Modern spreadsheet tools allow you to move beyond basic formulas, utilizing programmatic sorting and AI-assisted categorization to instantly tag transactions as they arrive. This automated processing prevents the common reconciliation errors and missing entries that plague manual systems.
Step 3: Generate real-time cash flow summaries
The final step is rolling up your categorized data into a clean dashboard. Structure your view so that your beginning balances, inflows, and outflows automatically calculate to show your exact current cash position. The ultimate goal is to create a single workspace where your balances and cash flow trends live side-by-side. When properly configured, this summary will update automatically as new transactions clear.
Building a bank account balance spreadsheet in Quadratic
Building a live bank account balance spreadsheet is a powerful step toward real-time financial visibility, but traditional tools often fall short once complexity increases. Quadratic addresses this gap by turning your spreadsheet into a live, programmable financial system that continuously syncs, analyzes, and visualizes your data. Let’s explore the features of Quadratic.
Sync live bank balances and transactions directly into your spreadsheet
Quadratic connects directly to bank accounts, credit cards, and brokerages via its Plaid integration, automatically importing balances and transaction data into your spreadsheet grid. This eliminates the need for manual exports or periodic uploads.
Because the data updates continuously, your spreadsheet becomes a real-time reflection of your financial position. You can track cash flow across multiple accounts without worrying about stale or outdated numbers.
Automate cash flow tracking and categorization logic
Quadratic enables you to build automated systems for categorizing transactions and tracking inflows and outflows. Using formulas, rules, or scripts, you can define exactly how transactions should be processed.
This removes the repetitive burden of manual classification while improving consistency. Your cash flow statements update automatically as new transactions are ingested.
Extend your workflow with Python and SQL for advanced modeling
Quadratic includes native support for Python and SQL, enabling you to build advanced financial models directly within your spreadsheet. You can create forecasts, liquidity models, or scenario analyses.
This transforms your spreadsheet into a powerful analytical tool. You are no longer limited to basic formulas; you can implement sophisticated financial logic tailored to your needs.
Combine real-time balances with forward-looking projections
Quadratic allows you to move beyond current balances by incorporating projections and forecasting models. You can estimate future cash positions based on income patterns and recurring expenses.
This helps you anticipate potential shortfalls or surpluses. Your spreadsheet becomes a proactive planning tool rather than a reactive tracking system.
Use AI to analyze balances and spending patterns
Quadratic’s AI capabilities allow you to interpret your financial data at a deeper level. You can generate summaries of spending behavior, identify anomalies, or highlight trends across time periods.
This turns your spreadsheet into an intelligent assistant. Instead of just viewing balances, you can quickly understand what is driving changes in your financial position. Let’s see how this works.
First, I connect to my bank account using Quadratic’s Plaid integration:
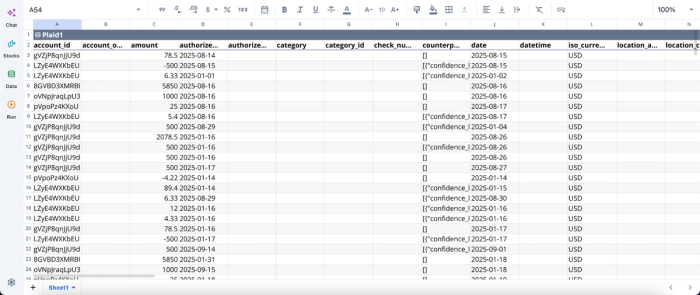
After successfully connecting to my account balance, I can begin analysis immediately:
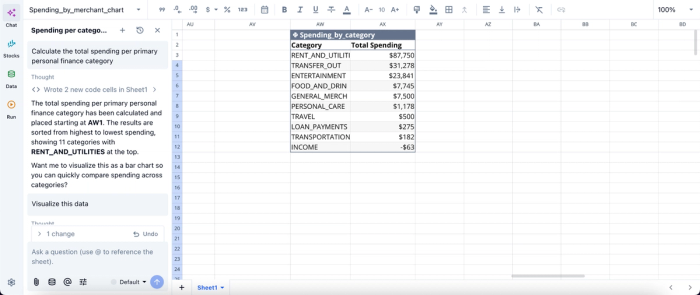
Here, I ask Quadratic to “Calculate the total spending per primary personal finance category.” It creates a table that gives instant insights into the spending by category based on my account balance.
Build dynamic dashboards for real-time financial visibility
Quadratic allows you to create financial data visualizations and custom dashboards that visualize account balances, cash flow trends, and financial health metrics. These dashboards update automatically as new data flows in.
This makes it easy to monitor your finances at a glance. You can instantly identify fluctuations and make informed decisions without manual recalculations. Visualization in Quadratic can also be done by using text prompts:
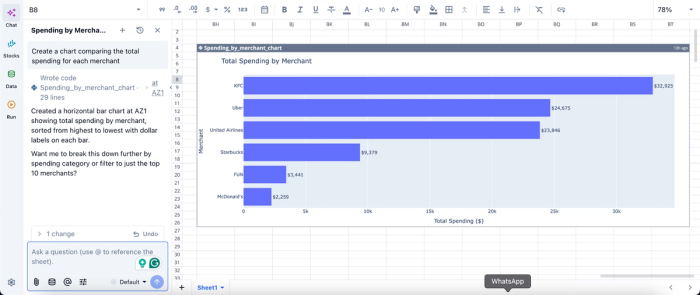
Here, I simply ask Quadratic AI to “Create a chart comparing the total spending for each merchant.” In seconds, it creates an interactive chart that displays the total spending by merchant, allowing users to immediately gain insights from their account balance.
Collaborate on shared financial views
Quadratic supports real-time collaboration, allowing multiple users to access and work on the same financial model simultaneously. This is especially useful for households or finance teams managing shared accounts.
Collaboration ensures alignment and transparency. Everyone involved can view the same data and contribute to the same system without version control issues.
Conclusion
Moving away from error-prone manual entry to a live financial dashboard is a game-changer for managing your money. It provides the peace of mind and strategic advantage that only comes from having real-time visibility into your cash positions and historical trends. By leveraging modern API connections and automated processing, you can spend less time wrangling data and more time making informed financial decisions. Quadratic allows you to build a live bank account balance spreadsheet and cash flow dashboards with connected account data. Try Quadratic for free.
Frequently asked questions (FAQs)
What are the risks of using a manual Excel bank account balance spreadsheet?
Manual data entry for your Excel bank account balance spreadsheet is prone to human error, leading to inaccuracies and hours spent reconciling discrepancies. This approach also creates a significant data lag, meaning your financial picture is outdated the moment you finish entering information.
How can I maintain a truly live bank account balance spreadsheet?
To keep your bank account balance spreadsheet live, you should transition from manual CSV exports to automated financial workflows. This involves using secure API connections to pull real-time account balances and transaction details directly into your workspace.
How does Quadratic help build an automated bank account balance spreadsheet?
Quadratic connects directly to your bank accounts via Plaid, automatically pulling in live balances and transaction history. It then allows you to leverage native Python, standard formulas, and built-in AI for automated categorization and processing, transforming your data into a dynamic cash flow dashboard.