
James Amoo, Community Partner
May 7, 2026

Achieving Financial Independence, Retire Early (FIRE) is a major life goal that requires precise financial forecasting. For decades, planners have relied on fixed accounting dashboards to track their net worth. However, reaching FIRE requires more than just looking backward at what you have saved. It demands a dynamic financial model that adapts to your changing realities over time. A robust fire spreadsheet acts as a comprehensive tool to test various retirement timelines and adapt to the unexpected.
In this article, we will cover how to structure the core modules of your spreadsheet, run advanced scenario analyses, and automate your data inputs to keep your model continuously up to date.
The problem with a static FIRE budget spreadsheet
One of the biggest dangers in retirement planning is relying on static assumptions for a timeline that spans decades. When you use a traditional budget app or spreadsheet, you are often forced into tedious manual data exploration and ingestion. Updating balances and categorizing expenses by hand quickly leads to user fatigue, causing models to fall out of date and obscuring critical financial insights.
Furthermore, a basic fire Excel spreadsheet usually relies on hardcoded numbers. This rigid structure makes it incredibly difficult to model variable investment returns or shifting living expenses. If your entire plan hinges on a fixed average return and unchanging monthly costs, a single market downturn or life event can render your calculations useless.
Quadratic addresses these limitations by transforming static spreadsheets into dynamic and data-driven models. Instead of hardcoding assumptions, you can integrate live financial data, simulate multiple return scenarios using Python, and automatically update projections as inputs change. This allows you to build a flexible FIRE model that adapts to real-world conditions, giving you a more resilient and accurate view of your long-term financial plan.
Core modules of a FIRE planning spreadsheet
To transition from merely tracking historical data to actively forecasting your future, you need a structured financial reporting system. A reliable fire planning spreadsheet breaks down complex financial data into manageable modules. The best practice for any financial model is to strictly separate your raw data inputs from your calculation logic. This keeps your spreadsheet clean and ensures that your model remains flexible as your financial situation evolves.
Module 1: Historical tracking and cash flow
The foundation of your model begins with your current financial reality. Set up dedicated input fields for your total net worth and living expenses. Accurately tracking your current savings rate is critical, as this metric forms the mathematical baseline for your entire retirement timeline.
To make future forecasting easier, group your current expenses into essential and discretionary buckets. Essential expenses cover your non-negotiable living costs, while discretionary spending represents lifestyle choices. Categorizing your cash flow this way allows you to easily model future lifestyle changes, such as cutting back on travel during a market downturn or increasing your budget once your investment portfolio hits a specific milestone.
Module 2: Investment growth and assumptions
Once your baseline is established, you need to project how your wealth will compound over time. This module relies on formulas that project future portfolio values based on your current ongoing contributions and the power of compound interest.
Instead of burying your expected growth rates inside complex formulas, build a live bank account balance spreadsheet. This spreadsheet should house editable variables for expected inflation rates and anticipated market returns. Keeping these inputs flexible rather than hardcoding them allows you to rapidly adjust your projections when economic conditions change, ensuring your model can adapt to new information instantly.
Module 3: The scenario dashboard
The true value of your financial model comes to life in the summary view. This module calculates the exact moment when your projected passive income exceeds your anticipated living expenses.
When finance professionals explore a fire spreadsheet template, they are usually looking for this kind of top-level visibility. Your dashboard should display high-level metrics right at the top of the sheet. Key figures to feature include your estimated years to FIRE, your total required nest egg, and your current projected withdrawal rate. Consolidating these metrics into a single dashboard provides immediate feedback whenever you tweak your underlying assumptions.
How to stress-test your FIRE calculator spreadsheet
With your core modules in place, your focus should shift to advanced scenario analysis. A robust model acts as a fire calculator spreadsheet, allowing you to test different financial realities against your baseline plan. By treating your document as a dynamic fire spreadsheet calculator, you can simulate various economic conditions and life events to ensure your retirement strategy is truly resilient.
Adjusting withdrawal rates
The safe withdrawal rate is one of the most debated topics in retirement planning. Your model should allow you to test the standard 4% rule alongside more conservative 3% or more aggressive 5% withdrawal rates.
Changing this single variable drastically impacts both the total required nest egg and the number of years you have left to work. Provide a dedicated input cell for your withdrawal rate and link it directly to your scenario dashboard. This setup gives you real-time feedback, showing exactly how a slight reduction in your planned retirement spending can accelerate your timeline to financial independence.
Modeling variable returns and inflation
Relying on a single average return for the next forty years is a risky strategy. You need to run scenarios that simulate prolonged bear markets or periods of unusually high inflation.
Use coding spreadsheets to run multiple return scenarios side-by-side. For example, you can compare a steady 7% real return against a sequence of returns that includes a significant market crash just as you retire. Testing your plan against worst-case historical market cycles is crucial for building a resilient FIRE plan that can withstand actual economic volatility.
Factoring in shifting life expenses
Your spending will not remain static throughout your life. You need to model major life changes, such as paying off a mortgage, funding education, or facing increased healthcare costs in later years.
Build an investment dashboard that allows expenses to step up or down in specific future years. If you plan to relocate to a lower-cost area in five years, your model should automatically reduce your essential expenses at that exact milestone. A truly flexible model must adapt to these expense shocks without breaking the underlying formulas.
Automating your FIRE model with Quadratic
Maintaining a complex financial model manually can quickly become a part-time job. Quadratic represents the ultimate evolution of the fire spreadsheet, solving the manual data entry problem entirely. Let’s explore the features of Quadratic in detail.
Connect your full financial picture into one live model
A robust FIRE model depends on more than static assumptions; it requires a continuously updated view of your financial life. Quadratic enables direct connections to multiple finance data sources, allowing you to leverage its Plaid integration to pull in live data from bank accounts, brokerage portfolios, and macroeconomic indicators directly into your spreadsheet.
This is especially powerful for FIRE planning because it allows you to reconcile long-term projections with real-world variability. You can dynamically blend income streams and portfolio performance into a single model, ensuring your retirement scenarios are always grounded in current data rather than outdated snapshots.
Build advanced financial simulations with Python and formulas
Traditional spreadsheets like Excel and Google Sheets struggle with the complexity required for realistic FIRE modeling, particularly when introducing probabilistic simulations. Quadratic addresses this by allowing you to combine native spreadsheet formulas alongside Python and SQL in the same environment. This enables you to implement Monte Carlo simulations, model sequence-of-returns risk, and calculate portfolio longevity with far greater precision.
By embedding this logic directly in the grid, your model remains transparent and auditable. You can inspect assumptions and extend your simulations without moving data between separate tools.
Automate your FIRE model with scheduled updates
One of the biggest weaknesses of traditional FIRE spreadsheets is that they quickly become outdated. Quadratic solves this by allowing you to schedule automatic refreshes of your data and calculations. Your model can run in the background, updating investment performance, recalculating projections, and refreshing dashboards without manual intervention.
This spreadsheet automation transforms your FIRE spreadsheet from a static planning tool into an ongoing financial monitoring system.
Integrate tax, inflation, and lifestyle variables into one framework
A realistic FIRE plan must account for taxes, inflation, and changing spending patterns. Quadratic allows you to integrate these variables directly into your model by pulling in external datasets and applying custom logic. You can model after-tax withdrawal strategies, adjust for regional inflation trends, and simulate how lifestyle changes impact your long-term sustainability.
By consolidating these factors into a single spreadsheet for taxes workflow, you avoid the fragmentation that typically plagues advanced financial planning. The result is a comprehensive FIRE model that reflects the true complexity of real-world retirement scenarios.
Model retirement scenarios with AI-assisted financial logic
FIRE planning involves withdrawal rates, sequence-of-returns risk, sensitivity analysis, and lifestyle changes over time. Quadratic’s AI capabilities help you construct and refine these models without building every formula or script manually. You can prompt the system to generate projections for safe withdrawal rates, simulate different savings trajectories, or stress-test your plan under varying market conditions.
This approach significantly reduces iteration time while maintaining analytical rigor. Instead of spending hours debugging formulas, you can focus on evaluating whether your assumptions are realistic and how small changes in savings rate or return expectations impact your path to financial independence.
Let’s see how we can conduct analysis on financial datasets using text prompts. First, I connect to my financial dataset via Quadratic’s Plaid integration:
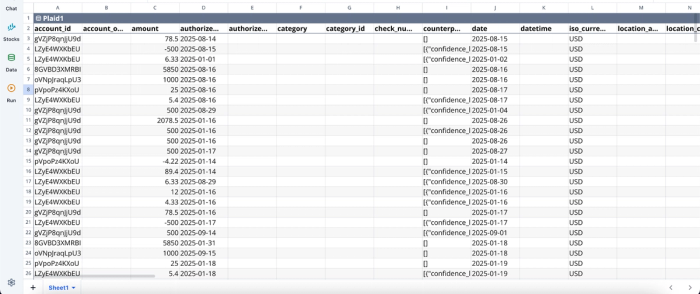
After successfully connecting to my bank account, I can immediately begin analysis:
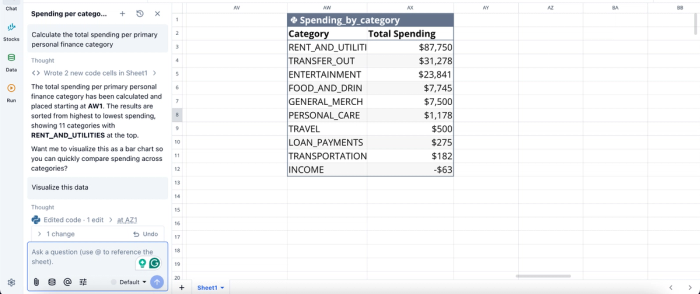
In this image, I ask Quadratic AI to “Calculate the total spending per primary personal finance category.” It generates a table that shows the total spend amount for each category.
Visualize long-term outcomes with dynamic scenario dashboards
A FIRE model is only useful if it clearly communicates outcomes. Quadratic allows you to build financial data visualizations directly on top of your model. You can create different chart types that track net worth progression, visualize withdrawal sustainability over decades, or compare multiple retirement scenarios side by side.
This makes it easy to explore “what-if” scenarios in real time, such as adjusting retirement age or modeling different inflation environments without rebuilding your charts. Visualizations in Quadratic can also be done using text prompts:
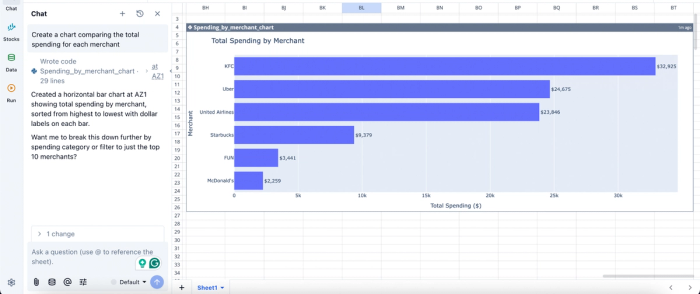
In this image, I ask Quadratic AI to “Create a chart comparing the total spending for each merchant.” In seconds, it creates a chart that gives visual insights into the total spending for each merchant.
Collaborate on financial planning without version control issues
FIRE planning is often iterative and collaborative, whether you are working with a partner, financial advisor, or accountability group. Quadratic’s collaborative analytics platform allows multiple users to work on the same model simultaneously, eliminating the confusion of multiple spreadsheet versions.
This shared environment ensures that all stakeholders are aligned on assumptions and outcomes. Changes are immediately visible, making it easier to validate decisions and maintain a single source of truth for your long-term financial plan.
Start building your dynamic retirement plan
Adopting a scenario-driven approach to FIRE planning is far superior to relying on static historical tracking. Real-time financial models empower you to make better decisions, adapt to economic shifts, and significantly reduce your longevity risk. Instead of downloading another rigid fire spreadsheet template, you can build an automated system that grows alongside your wealth.
Connect your financial accounts to Quadratic and build a FIRE planning spreadsheet with live data, editable assumptions, and scenario dashboards. Try Quadratic for free.
Frequently asked questions (FAQs)
Why are static or traditional fire spreadsheets not ideal for retirement planning?
Traditional fire budget spreadsheets often require tedious manual data entry, leading to outdated information and user fatigue. Their rigid structure with hardcoded numbers makes it difficult to model variable market returns or changing living expenses, rendering calculations unreliable over long timelines.
What are the key modules for an effective fire planning spreadsheet?
An effective fire planning spreadsheet requires modules for historical tracking and cash flow, investment growth and assumptions, and a scenario dashboard. This structure separates data inputs from calculation logic, allowing for dynamic forecasting and clear visibility of key metrics like years to FIRE.
How does Quadratic improve the process of building a fire spreadsheet for retirement?
Quadratic automates the fire spreadsheet by integrating live financial data from bank and brokerage accounts, eliminating manual data entry. Its AI capabilities streamline expense categorization, and native Python allows for complex Monte Carlo simulations and direct access to stock market data for robust scenario analysis, making it a powerful fire planning spreadsheet solution.