James Amoo, Community Partner
Mar 3, 2026

Every year, the scramble begins. You hunt down CSV files from three different bank accounts, export transaction histories from payment processors, and dig through email folders for receipts without a proper receipt scanner OCR system. You likely dump all this data into a new file, creating a messy Excel sheet, spend hours manually formatting Excel columns, and hope the formulas hold together long enough to generate a Schedule C or P&L.
This annual panic happens because most people treat a spreadsheet for taxes as a one-off storage bin rather than a repeatable and automated system.
A better approach is to build a comprehensive data workflow. Instead of starting from scratch every tax season with a basic tax organizer template, you can design a structure that accepts raw data, applies predefined cleaning rules, and automatically outputs a tax-ready summary.
While traditional tools like Excel and Google Sheets are the standard for this, modern spreadsheets now allow for automated data ingestion and audit trails that make the process faster and less prone to breakage. This blog post will explore how to build an end-to-end spreadsheet for tax workflow.
The need for a tax spreadsheet workflow
There is a significant difference between a simple expense log, even the best expense tracker for small business, and a tax workflow system. A log is a static list of numbers; a workflow is a set of processes that ensures those numbers are accurate, categorized, and traceable.
The most critical element of a professional tax spreadsheet is auditability. If the IRS or a client asks about a specific deduction in the final report, you need to be able to trace that number back to the original bank transaction immediately, adhering to official IRS audit trail requirements. In many traditional workflows, data is hard-coded or copied and pasted manually. If a number changes during the review process, it is often overwritten without a record of why or where the original figure went.
A robust business spreadsheet for taxes separates the raw data from the final reporting logic. This ensures that your source of truth (the bank export) remains untouched. It reduces the risk of human error inherent in manual copy-pasting and creates a clear lineage from the initial transaction to the final tax line item.
Structuring your finance data for scale
To build a workflow that works next year without rebuilding it, you need to structure your workbook into three distinct layers, a concept similar to the data analytics lifecycle. This architecture prevents formulas from breaking when you paste new data and keeps your logic transparent.
- Input (Raw Data): These tabs are for data ingestion only. Whether it comes from a bank CSV, a credit card export, or an API connection, this data should remain exactly as it arrived. You should never manually edit cells in these tabs.
- Processing (Staging): This is the engine room. Here, you use formulas, SQL, or Python for data cleaning, transformation, and mapping of transactions to tax categories. This layer acts as the bridge that unifies different data formats into a single standard.
- Output (Summary): This is the clean, read-only view for the tax preparer. It aggregates the processed data into a format that matches tax forms, such as a P&L statement or a list of deductions by category.
By strictly adhering to this structure, you ensure that your tax spreadsheet for small business clients or personal finances, including AI personal finance tracking, remains stable. When next tax season arrives, you simply replace the data in the input tabs, and the output tabs update automatically. This is the essence of a repeatable Excel spreadsheet for taxes workflow, though modern tools handle this architecture much more gracefully than traditional sheets.
Building a spreadsheet for taxes workflow
When building a spreadsheet for taxes workflow. There are key steps to consider. In this section, we’ll explore a 3-step approach to ensuring your workflow is built for efficiency.
Step 1: Standardizing data ingestion
The biggest friction point in tax preparation is dealing with incompatible data formats. Your checking account export might format dates as MM/DD/YYYY, while your Stripe export uses YYYY-MM-DD. One file might call the column "Payee," while another calls it "Description."
To solve this, you need a "Master Data" table in the processing layer. This table should have a standardized set of columns that you require for tax reporting, such as Date, Source, Description, Amount, and Category.
In a standard business expense spreadsheet for taxes, you might use complex formulas to map columns from various tabs into this master table. However, if you are using advanced coding spreadsheet tools that support Python or SQL, you can write a database query to merge these datasets automatically. This allows you to stack data from multiple sources without dragging and dropping cell ranges.
Ideally, you should look for ways to connect directly to data sources via APIs rather than downloading files manually. This creates a tax expense spreadsheet that is always up to date, reducing the risk of missing transactions that occurred between your last download and the end of the year.
Step 2: Automating categorization and write-offs
Once your data is unified, the next step is assigning tax categories. This is where a spreadsheet for tax write-offs delivers the most value. Instead of manually typing "Office Supplies" next to every Staples purchase, you should build logic that does it for you.
For recurring vendors, you can create a reference table (a "mapping table") that lists vendor names and their associated tax categories. In a traditional sheet, you would use VLOOKUP or XLOOKUP to pull these categories into your transaction list.
For more complex situations, you need conditional logic. For example, a transaction from "Amazon" could be office equipment or personal use. You can flag these transactions for manual review programmatically.
If you are using a modern AI tool for data analysis, you can leverage AI or Python scripts to categorize transactions based on keywords or historical patterns, utilizing advanced spreadsheet automation techniques. This is a particularly useful alternative to an Excel spreadsheet template for tax deductions, where ambiguous transactions often get missed.
By automating the obvious 80% of transactions, you free up mental energy to focus on the 20% that require professional judgment, a strategy increasingly adopted as accountants are saving significant time through automation.
Step 3: Building review flags and validation
Speed is useful, but accuracy is non-negotiable in tax preparation. A good workflow also actively looks for errors. You should build a "QA Dashboard" or a set of validation columns that flag issues before you file.
Common validation checks include:
- Missing categories: Flag any row where the category column is empty.
- Duplicates: Identify transactions with identical dates, amounts, and payees.
- Unreconciled balances: Compare the sum of your spreadsheet for taxes against the ending balance on the actual bank statement.
In traditional tools, tracing errors can be difficult because the trace precedents' arrows get messy quickly. Using a workflow based on clear logic or code allows you to see exactly how data is being filtered and summed. This is vital for ensuring that your tax spreadsheet stands up to scrutiny.
How Quadratic fits: the modern tax spreadsheet
Quadratic transforms this entire process by combining spreadsheet familiarity with scripting and AI-assisted analysis directly inside the grid. Instead of treating spreadsheets as static calculators, teams can treat them as operational workpapers that continuously update as data changes.
Direct data connection
The first bottleneck in most tax workflows is data collection. Accountants and business owners often spend days gathering statements and reconciling mismatched formats before analysis even begins. Quadratic reduces this friction through direct connections to databases and APIs using Python or SQL.
Rather than manually importing files every month or quarter, transaction records can flow directly into structured tables. Businesses pulling data from accounting systems or internal databases can automate ingestion entirely, especially when utilizing the best AI for QuickBooks. Once it’s configured, refreshing the dataset becomes as simple as running an update rather than rebuilding spreadsheet tables from scratch.
Direct connections also improve accuracy. Since the data originates directly from source systems, there is less risk of version drift or accidental edits.
Native support for modern programming languages
Standard spreadsheet formulas work well for small datasets, but become difficult to maintain when tax preparation involves thousands of transactions across multiple accounts, leading many to seek alternatives to VBA.
Quadratic addresses this with native Python, SQL, and JavaScript support directly within the spreadsheet environment. SQL data analytics allows users to merge disparate transaction logs into a single master ledger using readable queries. Instead of managing multiple tabs filled with lookup formulas, accountants can join datasets based on dates, vendors, or account identifiers using database-style logic.
Python exploratory data analysis adds another layer of flexibility. Scripts can automatically identify deductible expenses or normalize inconsistent merchant names across datasets. Complex workflows become programmable processes rather than manual reconciliation exercises, acting as powerful tools for accuracy in payment transaction reporting
Repeatability and automation
One of the strongest advantages of a hybrid workflow is repeatability. Traditional tax spreadsheets are often rebuilt annually, forcing teams to recreate formulas, cleaning logic, and reporting structures each filing season.
With Quadratic, data connections, SQL queries, Python scripts, and dashboards can be configured once and reused indefinitely. When a new tax year begins, users simply refresh their sources and allow the workflow to run again. Categorization rules apply automatically, reconciliations update instantly, and summaries regenerate without manual rebuilding.
This approach transforms tax preparation from a stressful annual project into a continuously maintained system using spreadsheet automation. Over time, accuracy improves because workflows mature alongside the business rather than restarting from zero every year.
AI for data analysis and visualization
Quadratic’s built-in AI assistance helps to accelerate the process of tax preparation. Quadratic AI can assist with cleaning merchant descriptions or flagging unusual expenses that may require review. Instead of manually scanning thousands of rows, accountants can focus attention on exceptions and high-risk entries.
AI analysis also supports deeper insights. Large or irregular expenses can be highlighted automatically, duplicate charges detected, or transactions grouped by behavioral patterns rather than simple keyword matching. For businesses with evolving operations, this adaptability helps maintain consistent categorization even as vendors or payment structures change throughout the year. Let’s see this in action.
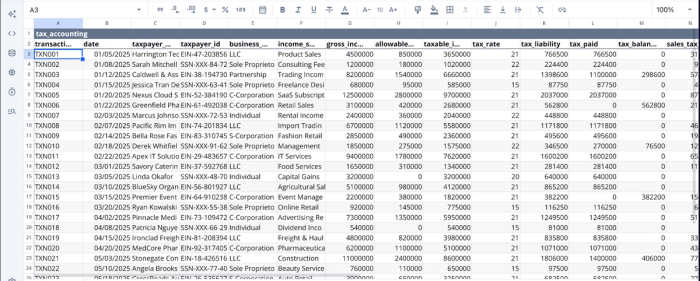
Here, I have a sample tax data imported into Quadratic:
Suppose I want to get insights into businesses that get heavy deductions, all I have to do is ask:
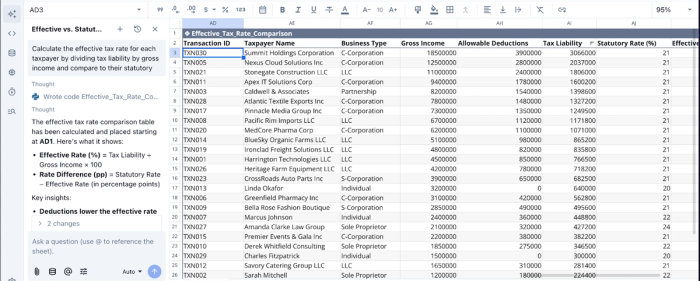
I prompt Quadratic AI, “Calculate the effective tax rate for each taxpayer by dividing tax liability by gross income and compare to their statutory rate.” It instantly generates a new table, showing the tax rate comparison for each taxpayer. Accountants no longer have to spend hours and days to get insights from their data; Quadratic makes it as seamless as asking questions in plain English.
Quadratic also allows non-technical users to create interactive visualizations, using this same approach of natural language queries. Here:
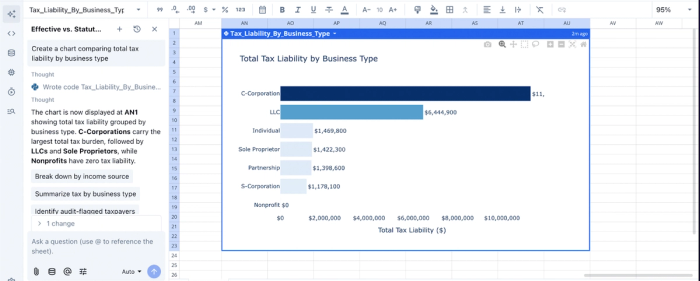
In the image above, I created a chart in seconds simply by prompting Quadratic to “Create a chart comparing total tax liability by business type.” Users can create complex visualizations from their dataset using different chart types.
Real-time collaboration
Tax preparation rarely involves a single person. Business owners provide context, accountants apply regulatory expertise, and sometimes financial advisors or bookkeepers contribute supporting data. Traditional workflows rely heavily on email attachments or exported spreadsheets, creating confusion about which version is current.
Quadratic’s collaborative analytics platform allows stakeholders to review and work within the same dataset simultaneously. Accountants can leave comments requesting clarification on specific transactions while clients respond directly within the sheet. Questions that previously required long email chains can be resolved quickly with shared visibility into the numbers.
Conclusion
Moving from a manual data entry mindset to a workflow design mindset is the single best investment you can make to build an efficient spreadsheet for taxes workflow. A structured system reduces the anxiety of finding the numbers and provides the audit trail necessary to defend them. By separating your raw inputs from your reporting outputs and automating the cleaning process, you turn a chaotic annual event into a manageable and repeatable task.
With Quadratic, you can clean your tax data faster, import your transactions, standardize categories, and build review-ready summaries for tax prep. Try Quadratic for free.
Frequently asked questions (FAQs)
What is the advantage of a repeatable tax spreadsheet workflow over a simple expense log?
A repeatable tax spreadsheet workflow goes beyond a static list by establishing processes to ensure data accuracy, proper categorization, and traceability. This structured approach transforms a chaotic annual task into a reliable system that saves time and reduces errors. It ensures your spreadsheet for taxes is a dynamic tool, not just a storage bin.
Why is auditability important for a business expense spreadsheet for taxes?
Auditability is critical because it allows you to trace every number in your final report back to its source transaction. This transparency is essential for validating deductions with the IRS or clients and ensures the integrity of your business expense spreadsheet for taxes. Without it, verifying figures or understanding changes becomes difficult.
How does Quadratic enhance the creation of a tax spreadsheet?
Quadratic streamlines the tax spreadsheet process by integrating native Python, SQL, and formulas within a familiar spreadsheet interface. It allows direct data connections from various sources, automating ingestion and cleaning, which eliminates manual CSV imports. This enables users to build a highly repeatable spreadsheet for taxes that updates automatically each year.
What are the core architectural layers for an effective business spreadsheet for taxes?
An effective business spreadsheet for taxes should be structured into three distinct layers: Input for raw, unedited data; Processing for cleaning, normalizing, and categorizing transactions; and Output for a clean, tax-ready summary. This layered architecture prevents formula breakage and maintains data integrity, making it a robust business spreadsheet for taxes.