
James Amoo, Community Partner
May 26, 2026

Table of contents
Filtering a spreadsheet for a one-time question is easy. Filtering the same way every week, against new data, with logic that someone else needs to understand, is where things get expensive. That gap is where advanced autofilter Excel quietly becomes a productivity bottleneck for analysts and reporting teams.
The mechanics of autofilter and advanced filter in Excel are well documented, and most intermediate users can construct multi-condition criteria when they need to. The problem is that filter logic in Excel does not persist as logic. It persists as a state on a worksheet, which means every reporting cycle starts with reconstruction work that compounds across files, collaborators, and time.
This post maps the specific failure points where advanced filtering breaks down at workflow scale: the documented performance limits, the fragility of criteria ranges, and the manual reconstruction tax that no tutorial mentions. Then it looks at what filtering should actually look like when it is part of a recurring workflow, not a one-off lookup.
Autofilter vs. advanced filter: where each one actually fits
Excel offers two filtering systems, and they solve different problems. AutoFilter places dropdown menus directly in the column headers and filters the table in place. Advanced Filter uses a separate criteria range on the sheet and can either filter in place or copy matching rows to a new location.
AutoFilter is fast and visual, but it carries a documented hard constraint: each dropdown displays only the first 1,000 unique items. On large datasets, the values you are looking for may simply not appear in the list, which forces a switch to a more capable approach.
Advanced Filter is the standard workaround. It supports multi-column logic, formula-based criteria, and result extraction. It is also the source of a new set of problems, because once your filter conditions live in a criteria range, you have created a small piece of logic that someone has to maintain.
Quadratic streamlines both approaches by replacing rigid spreadsheet filtering workflows with AI-assisted analysis and spreadsheet coding directly inside the grid. Instead of manually maintaining fragile criteria ranges or navigating dropdown limitations, users can describe filters in plain language, generate Python or SQL dynamically, and apply complex multi-variable data transformation across live datasets instantly.
Multi-condition logic: AND, OR, contains, and does-not-contain patterns
The criteria range is where Advanced Filter gets its power and its fragility. The convention is simple in principle: conditions on the same row are combined with AND, and conditions on different rows are combined with OR. In practice, expressing real business questions in that grid layout becomes verbose quickly, and the syntax has subtle traps.
Most analysts end up building the same handful of patterns over and over: contains, OR-contains, and combinations of inclusion and exclusion. None of them is difficult on its own. The friction shows up when you try to maintain them across changing data and collaborators.
Contains and OR-contains criteria
For a contains pattern, you typically use wildcards like term inside a criteria cell to match substrings. Stacking multiple OR conditions means adding rows to the criteria range, one per condition, and remembering that any row matching any criterion produces a hit.
The advanced autofilter contains or excel pattern is where mistakes start to appear. Analysts often forget that adding a value to a new row creates an OR, while adding it next to an existing condition creates an AND. The result is filters that quietly return the wrong subset, especially when the criteria range grows to five or ten rows.
Does-contain and does-not-contain combinations
Mixing inclusion and exclusion in one criterion range is where things get especially brittle. The advanced autofilter does not contain or does contain Excel pattern that requires a careful mix of wildcard expressions, negated comparisons like <>term, and disciplined row layout to encode the intended Boolean logic.
These expressions break in predictable ways. Renaming a column header invalidates the criteria. Reordering columns can shift references. Pasting in a fresh dataset with slightly different values silently changes which rows match. There is no error, just a different answer.
Formula-based criteria for advanced cases
For more complex filtering, Excel allows formula-based criteria that reference cells and return TRUE or FALSE. This is the most powerful form of Advanced Filter and the closest the feature gets to programmatic logic. It is also where the feature starts to feel like a workaround for something the spreadsheet should support natively, because the formula lives in a cell off to the side, with no signal to anyone else that it is the brain of the report.
The hidden cost: where advanced autofilter becomes a bottleneck
Tutorials cover the syntax. They rarely cover what happens to that syntax when it has to survive a quarter of financial reporting cycles, three handoffs, and a column rename. This is where advanced autofilter stops being a feature and starts being a maintenance liability.
Performance degradation on large or formula-heavy files
Filter operations interact with Excel's calculation engine. On large workbooks with many dependent formulas, applying or changing a filter can trigger recalculations that visibly slow the application. Microsoft's developer guidance acknowledges that filter performance degrades as workbooks accumulate formulas, volatile functions, and historical sheets.
The practical effect is that the file that was fast in January becomes sluggish by June, and the analyst pays the cost on every refresh.
Criteria ranges that become invisible infrastructure
A criteria range is a small block of cells, often tucked away in an empty corner of the sheet, that encodes the filter logic. To the original author, it is obvious. To a collaborator opening the file three months later, it is not a good data analytics strategy.
There is no built-in audit trail for why a particular condition exists. There is no warning when a column rename breaks a reference. There is no documentation tied to the logic itself. The filter works until it doesn't, and when it doesn't, someone has to reverse-engineer the original intent.
Manual reconstruction every reporting cycle
This is the cost that nobody puts on a slide. Filters in Excel persist as states, not as logic. Every new dataset, every refresh, every monthly report tends to require rebuilding or reapplying the criteria range. Even when the structure is preserved, the analyst has to verify that it still produces the expected results.
Multiply that by the number of reports an analyst owns, and the time cost compounds quickly, which is exactly the problem that spreadsheet automation is designed to solve. The work is not hard. It is just constant, and it scales linearly with the number of reporting cycles, which is the wrong direction for a productivity feature.
How Quadratic fits: filter logic that lives in the spreadsheet
Quadratic is a code-native, AI-powered spreadsheet where filter conditions are expressed as formulas or Python directly in the grid. Instead of configuring a criteria range that encodes logic implicitly through row-and-column conventions, you write the condition once, in code, and it lives in the spreadsheet alongside the data. Let’s explore the features of Quadratic in detail.
Connect live data sources instead of filtering static exports
A major limitation of traditional spreadsheet filtering workflows is that they usually operate on exported snapshots rather than live operational data. Analysts repeatedly download CSVs, rebuild filters, and recreate reports from scratch every reporting period. Quadratic eliminates much of this repetitive work by supporting direct connections to APIs, databases, and external data sources inside the spreadsheet environment.
This allows teams to filter live business data directly from operational systems instead of working on disconnected exports. Sales teams can segment CRM records in real time. Finance teams can filter accounting dashboards for financial reporting. Product teams can monitor cohort analysis from live event streams. Market analysts can navigate funnel analysis without rebuilding imports every day.
Use Python and SQL for scalable filtering and transformation logic
As datasets grow larger and business rules become more sophisticated, traditional spreadsheet filters begin to break down. Multi-condition segmentation, fuzzy matching, and multi-table joins quickly exceed what is practical with manual filtering tools alone. Quadratic addresses this by combining spreadsheet usability with native Python and SQL data analytics execution directly in the grid.
Analysts can use pandas-based workflows to create scalable filtering pipelines that remain fully inspectable and editable. Complex transformations like deduplication, conditional grouping, rolling-window calculations, or cross-dataset enrichment can happen alongside formulas and charts in the same workspace. The spreadsheet becomes capable of handling workflows that would traditionally require a separate scripting environment.
Crucially, the Python logic remains visible to everyone working on the file. Anyone reviewing the sheet can inspect the exact data processing steps, rerun them against new data, or modify the logic without reverse-engineering external scripts.
Describe complex filters in plain English with AI
One of the biggest bottlenecks in advanced filtering workflows is translating business intent into technical logic. Analysts often know the segment they want but struggle to express it cleanly using nested formulas or multi-condition filters. Quadratic removes that friction by allowing users to describe filters in natural language and letting AI agents for data analysis to generate the underlying logic directly in the sheet.
You can ask Quadratic AI to “find customers with declining order frequency but rising average order value,” “surface transactions that deviate from historical spending patterns,” or “identify stocks with improving margins and unusually high news volume.” It translates those requests into working formulas or Python expressions tied directly to the dataset already loaded in the workbook.
Let’s see how this works. First, I import my Excel file into Quadratic:
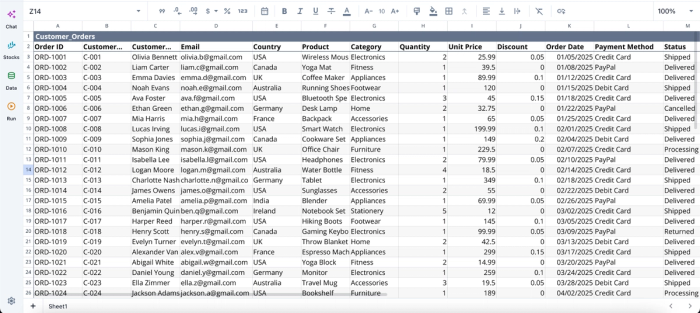
After importing our data into Quadratic, we can immediately begin filtering with AI:
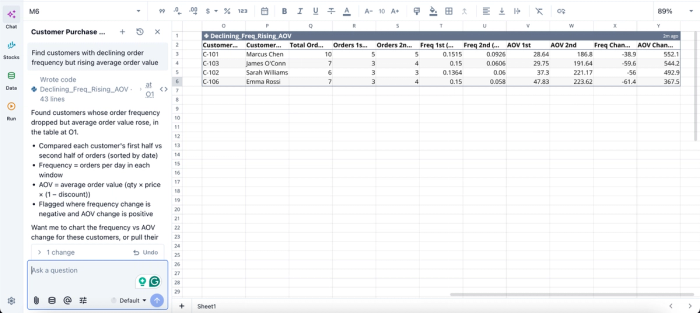
In this image, I ask Quadratic AI to “Find customers with declining order frequency but rising average order value.” It instantly creates a table that highlights customers that fit into that specific filter. This eliminates hours of trying to figure out advanced filters with complex formulas or code.
Turn filtered data into live analytical dashboards
Filtering is rarely the final destination in a modern spreadsheet workflow. In most cases, filtered datasets feed downstream dashboards, charts, summaries, and reporting pipelines. Quadratic is designed around this broader analytical workflow, allowing filtered outputs to flow directly into visualizations and reporting layers without exporting data into another tool.
Once a segment is created, you can immediately generate charts that track category performance, track KPIs, visualize anomalies, or compare filtered cohorts across time periods. The charts, formulas, Python logic, and source data all live in the same environment, which means dashboard updates become automatic whenever the underlying data refreshes.
This reduces the maintenance overhead that usually accompanies recurring reporting workflows. Instead of rebuilding filters and manually updating summaries each cycle, the entire analysis pipeline reruns inside the same workspace. The result is a reusable reporting system rather than a static spreadsheet snapshot.
Here’s an example:
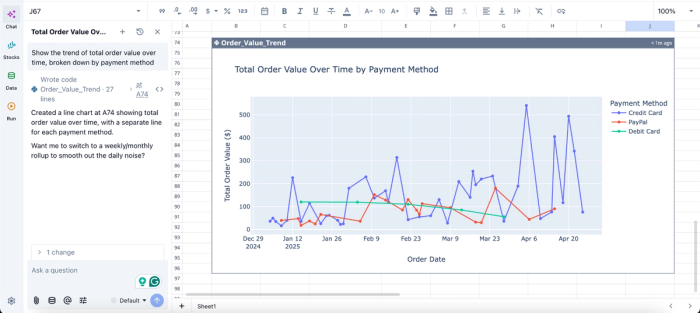
In this image, I ask Quadratic AI to “Show the trend of total order value over time, broken down by payment method.” In seconds, it creates a chart that shows the total order value over time. This makes it easy to communicate your data to non-technical stakeholders.
Collaborate on shared filtering and reporting workflows
Filtering workflows often become fragile because different team members maintain separate spreadsheet copies with slightly different assumptions and manual edits. Quadratic replaces this fragmented process with a collaborative analytics platform where teams can work from a shared analytical source of truth.
This collaborative structure is particularly valuable for recurring reporting cycles where transparency and repeatability matter. Instead of asking “which version of the spreadsheet is correct,” teams work from a single live workflow where formulas, filters, charts, and Python transformations remain visible and auditable from end to end.
Conclusion
The bottleneck in advanced filtering is the gap between filtering as a state, which is what Excel offers, and filtering as logic, which is what recurring workflows require. Reconstruction is the real cost, and it compounds quietly across every reporting cycle.
When your filter conditions live as readable code next to your data, the next reporting cycle stops starting from scratch, and advanced autofilter becomes a tool you reach for by choice rather than by default.
Move beyond advanced autofilter Excel in Quadratic by building reusable filtering and analysis logic directly in the spreadsheet with the help of Python and AI-powered analysis and visualization. Try Quadratic for free.
Frequently asked questions (FAQs)
Why does advanced autofilter become a bottleneck for recurring workflows?
The advanced autofilter feature in Excel requires manual reconstruction every reporting cycle because filter logic persists as a state on the worksheet rather than as reusable logic. Column renames, data refreshes, and criteria range maintenance compound across multiple reports and collaborators, creating a constant reconstruction tax that scales with the number of reporting cycles.
How does Quadratic solve the advanced autofilter problem?
In Quadratic, filter conditions are expressed as readable code or formulas directly in the grid, so the logic is visible and reusable against new data without manual reconfiguration. Instead of maintaining invisible criteria ranges, you write the filter once as code, and it reruns on demand, eliminating the reconstruction work that makes advanced autofilter a bottleneck.
When should I use VBA for advanced autofilter instead of switching tools?
VBA can automate filter repetition for a single power user with a stable file structure, but it creates maintainability problems: the logic becomes unreadable to collaborators, it lives in a binary file without real version control, and it is fragile across file structure changes and Excel versions. If your filtering is part of a collaborative or scaling workflow, moving to a tool like Quadratic is a better long-term choice than deepening the VBA maintenance burden.
