
James Amoo, Community Partner
May 19, 2026

If you are looking to scrape stock data to fuel your financial data analysis, you are not alone. Many analysts and developers search for how to scrape stock market data when official APIs seem out of reach or structured exports are unavailable. However, traditional web scraping is often a short-term fix for a long-term data problem.
While pulling pricing tables and company fundamentals directly from a website feels like a quick win, it carries hidden costs and severe technical unreliability. This post explores why web scraping usually fails as a sustainable solution and presents API-driven alternatives to help you collect reliable financial data without the constant headaches.
The problem with traditional Python scraping workflows
Many online tutorials teach users to build custom pipelines to extract and clean financial information. However, managing standalone scripts and maintaining database connections is massive overkill for analysts who primarily want to manage stock data in Excel. Building and babysitting custom infrastructure distracts you from your actual goal: analyzing the market and finding financial insights. You end up functioning as a data engineer rather than a financial analyst.
Quadratic simplifies this entire workflow by giving analysts a unified environment where they can pull live financial data, process datasets with Python, and analyze results directly inside a spreadsheet interface. Instead of maintaining disconnected scraping scripts and backend infrastructure, users can combine API integrations, Python-based transformations, AI-assisted analysis, and interactive visualizations in one collaborative workspace.
Why you shouldn't scrape stock market data
The financial sector is highly protective of its information. Compared to other industries, financial websites employ aggressive measures to safeguard their proprietary datasets, often adhering to strict data governance frameworks in the financial sector. When you scrape stock market data, you are fighting an uphill battle against platforms specifically designed to thwart automated extraction.
The highest hidden cost of web scraping is maintenance. Target websites frequently change their layouts, update their DOM structures, or alter how data loads on the page. Every time a site updates, your scraping script breaks. The hours spent troubleshooting and fixing broken scrapers heavily outweigh the perceived cost savings of avoiding official data feeds.
Legal risks and terms of service violations
Beyond the technical hurdles, extracting data from public financial websites carries significant ethical and legal considerations. Many financial platforms explicitly forbid automated data collection in their Terms of Service.
Violating these terms can lead to real-world consequences. Organizations have faced account bans and intellectual property disputes for unauthorized data harvesting. While this does not constitute formal legal advice, these are common industry pitfalls that data professionals must carefully evaluate before deploying a scraper.
Technical fragility and bot protections
Modern financial websites are not static HTML pages. They rely heavily on dynamic content rendering, complex CAPTCHA, and advanced bot protections designed to break brittle scraping scripts instantly.
If you are researching how to scrape stock market data using Python, you will quickly find that standard scraping libraries frequently fail against these modern security measures, prompting the need for reliable yfinance alternatives. Financial sites actively monitor traffic patterns. If they detect IP addresses exhibiting automated scraping behavior, they will swiftly block your access and cut off your data supply entirely.
Data quality and trustworthiness
Financial analysis requires precision, underscoring the importance of data accuracy in financial reporting. Relying on unverified HTML data is vastly inferior to using official regulatory filings or structured data from dedicated financial platforms.
Making financial or investment decisions based on incomplete or poorly parsed scraped data is incredibly dangerous. A single misaligned table row or skipped decimal point in your scraper can ruin an entire valuation model. Reliable research and data analysis demand trustworthy data sources, which web scraping fundamentally cannot guarantee.
Web scraping vs. financial APIs
The contrast between web scraping and official financial API integration is stark. Scraping is unpredictable and messy, constantly requiring you to clean and format raw text. In contrast, financial APIs are stable and highly predictable.
While APIs might have upfront costs or rate limits, they deliver structured data formats like JSON or CSV that are immediately ready for analysis. If you are searching for the best site to scrape stock data, the most effective pivot you can make is to stop looking for scrapable sites and start evaluating platforms that offer structured financial APIs instead. Leveraging a reliable API feed ultimately saves you time and keeps you compliant.
The long-term advantage of APIs to download historical stock data also lies in scalability and reliability. Scraping workflows tend to break under load and degrade as target websites change their structure. APIs, on the other hand, are designed specifically for programmatic access, meaning they can support higher query volumes and predictable uptime.
When combined with modern analysis environments, APIs become even more powerful. Instead of simply retrieving data, you can immediately integrate it into models, dashboards, and automated workflows without additional transformation layers. This shifts the focus from data processing to insight generation, which is where real value is created in financial analysis.
A better alternative: Reliable API workflows in Quadratic
Scraping stock market websites may appear convenient at first, but these workflows often become unstable as soon as page structures change or anti-bot protections are introduced. Quadratic offers a more durable alternative by allowing analysts to connect directly to structured financial APIs inside a spreadsheet-native environment. Let’s explore the features of Quadratic in detail.
Pull market intelligence directly into a live analytical workspace
Traditional financial API use cases often introduce fragmentation. Data retrieval happens in one environment, cleaning happens somewhere else, and visualization occurs in a separate BI tool. Quadratic removes this disconnect by combining API integration and analysis within a single collaborative workspace.
Analysts can retrieve live stock prices and economic indicators directly beside the Python scripts and dashboards that power their research. This creates a much faster workflow where teams can move immediately from raw financial data to portfolio analysis, stock screening, and reporting without building additional infrastructure.
Build transparent financial models with Python, SQL, and formulas
One of the biggest risks in complex market workflows is losing visibility into how calculations are produced. External scripts and hidden transformations can make softwares for stock market analysis difficult to audit and maintain. Quadratic solves this by bringing Python, SQL, and spreadsheet formulas into the same environment.
Analysts can compute valuation models and custom ranking systems directly beside the underlying datasets. Every transformation remains visible and reproducible. This approach supports best practices for financial reporting and significantly improves confidence in the resulting analysis.
Use AI to accelerate stock API integration and analysis
Connecting to financial APIs traditionally requires boilerplate code, authentication handling, and data cleaning pipelines before analysis can even begin. Quadratic streamlines this process with AI-assisted Python generation directly inside the spreadsheet.
Users can prompt the AI to generate API requests, normalize responses, flatten nested JSON payloads, and structure datasets automatically in the grid. This lowers the barrier to building sophisticated financial workflows while preserving full visibility into the underlying code.
Let’s see how this works using the fundamental analysis template in Quadratic:
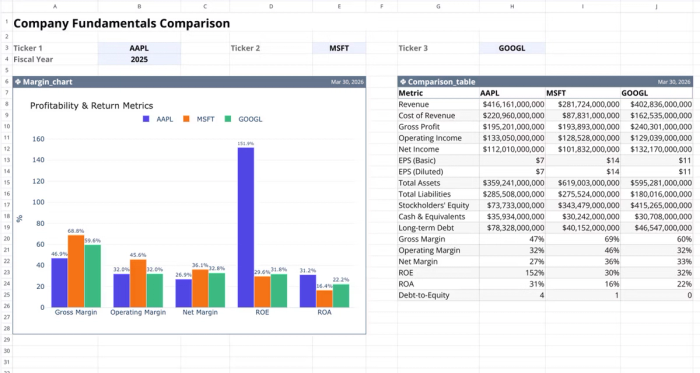
This template compares financial metrics for up to three companies across a single fiscal year. It automates data retrieval from a financial statements API for income statements, balance sheets, and key financial ratios, allowing you to visualize profitability and return metrics side-by-side for quick stock comparisons.
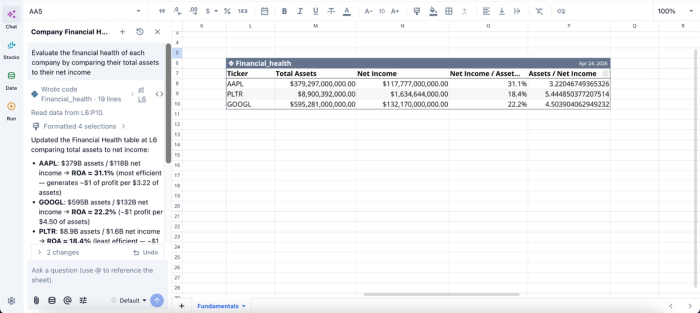
In this image, I asked Quadratic to “Evaluate the financial health of each company by comparing their total assets to their net income.” It generates a table that gives insights into several metrics for all the tickers, including the total equity, ROA, and equity ratio.
Turn live market data into dynamic visual dashboards
Reliable market intelligence becomes much more actionable when paired with real-time visualization. Quadratic enables users to build interactive financial data visualization and dashboards directly on top of live API-connected datasets without exporting information into separate BI platforms.
You can visualize portfolio performance, earnings trends, or data from a stock news API directly within the same workspace where the calculations occur. Because dashboards remain connected to continuously updating APIs and Python workflows, the analytical environment stays current automatically as market conditions change.
Visualization in Quadratic can also be done by using text prompts:
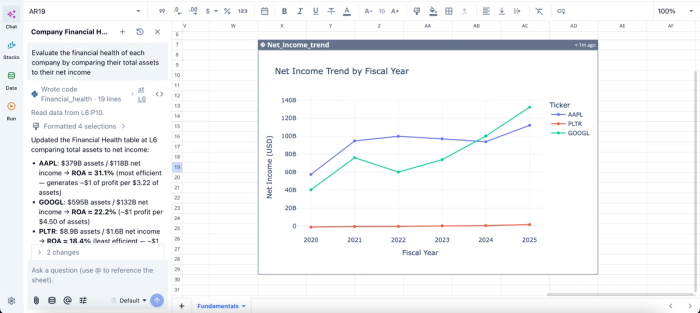
In this image, I ask Quadratic AI to “Visualize the trend of net income over the fiscal years for each company”. In seconds, it creates a chart that gives visual insights into the net income trend by fiscal year.
Collaborate on repeatable financial workflows
Financial research is increasingly collaborative, especially when multiple analysts contribute to screening models or operational reporting. Quadratic enables teams to work together in real time while maintaining a centralized source of truth for market data, code, and dashboards.
This structure eliminates many of the version-control and reproducibility problems associated with disconnected scraping scripts or exported spreadsheets. Teams can review assumptions and audit workflows together without leaving the platform.
Conclusion
Ultimately, analysts looking to scrape stock data must recognize the risk and fragility for serious financial analysis. The constant maintenance and threat of IP bans make it an unsustainable practice for modern data professionals.
Structured APIs provide the reliability, legality, and data quality required for accurate market research. By transitioning to official data feeds, you ensure your financial models are built on a solid foundation. Instead of adopting brittle scraping, Quadratic allows you to pull stock market data for AI-powered analysis and visualization in a single spreadsheet environment.
Frequently asked questions (FAQs)
What are the technical challenges when you try to scrape stock market data using Python?
When you try to scrape stock market data using Python, scripts frequently fail against modern bot protections, dynamic content, and CAPTCHA employed by financial websites. This leads to constant troubleshooting and rewriting of code, making it an unsustainable workflow for reliable data collection.
What is the best alternative to scrape stock data for financial analysis?
Instead of attempting to scrape stock data, the best alternative is to utilize official financial APIs, like a stock screener API, which provide stable and reliable datasets. These APIs ensure data accuracy and compliance, critical for robust financial analysis and decision-making.
How does Quadratic help analysts acquire reliable stock market data?
As a powerful MarketXLS alternative, Quadratic streamlines the process to acquire stock market data by allowing direct integration with financial APIs within its AI-powered spreadsheet environment. This approach enables users to pull rich market datasets using AI-generated Python without the fragility and maintenance issues of web scraping.