Purpose of this portfolio backtesting tool
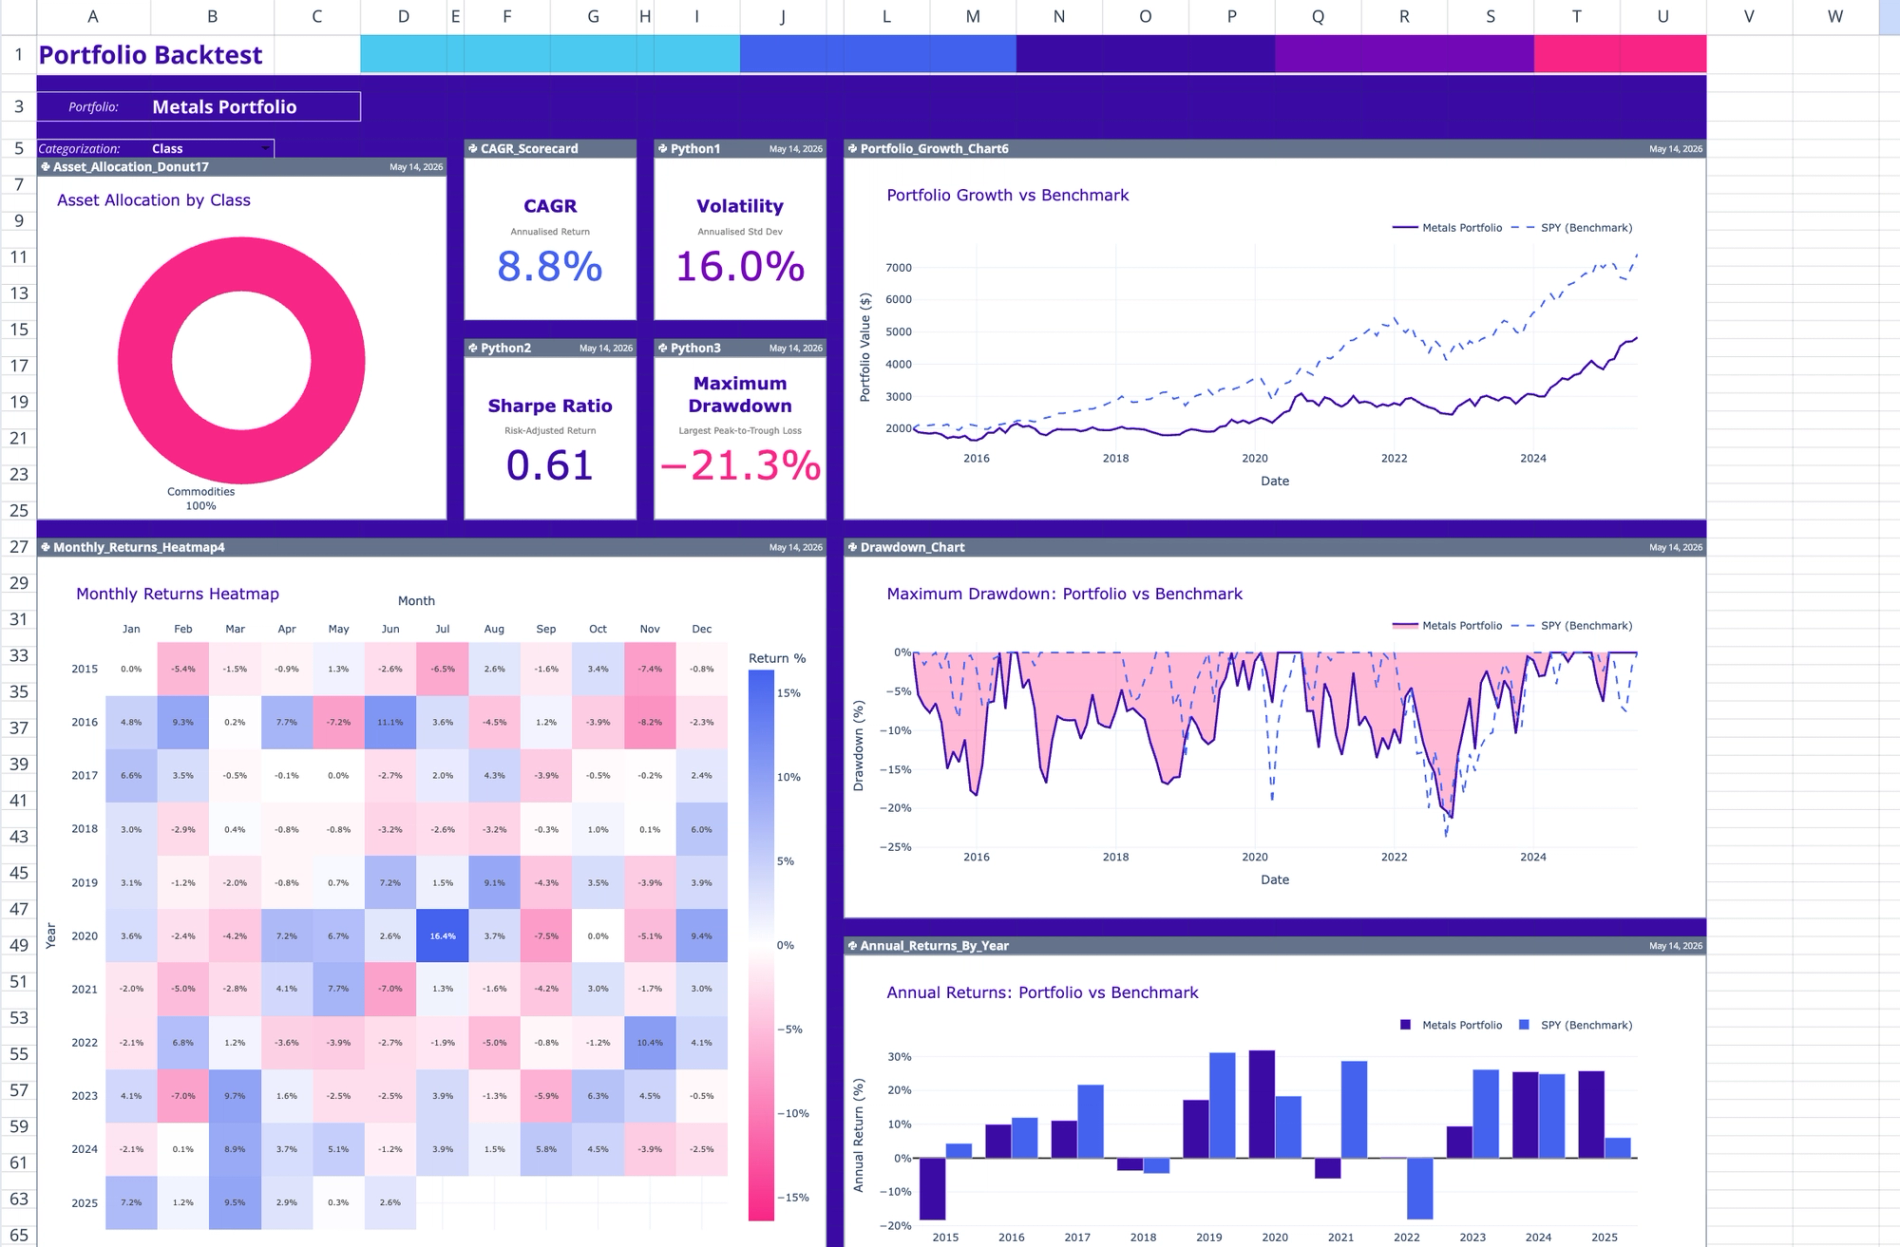
While many users start with a static investment portfolio template, this template provides a structured environment to evaluate the historical performance of custom asset allocations against a specific benchmark. It calculates key risk and return metrics using historical market data, allowing users to perform advanced financial data analysis on their investment strategies over time. The tool visualizes portfolio growth, drawdowns, and monthly returns in an interactive dashboard. It is designed to support complex scenarios, such as running a dividend portfolio backtest or applying custom contribution schedules.
Core components of the portfolio backtester
Data sheet
The data sheet houses all manual user inputs and intermediate Python computations, turning a standard investment portfolio spreadsheet into a dynamic backtesting engine. It contains tables for portfolio settings, storing details like dates, initial capital, and rebalancing rules. It also stores asset allocations, mapping specific tickers to their target weights. Using real-time financial data, the sheet calculates metadata, verifies that the allocation status equals exactly 100 percent, and computes underlying portfolio metrics.
Dashboard sheet
The dashboard sheet surfaces all visual outputs and interactive controls. It drives chart updates through two main selector cells for the portfolio name and the categorization grouping. Based on the selected portfolio, the sheet dynamically renders Plotly-based scorecards and charts. To ensure accurate and isolated rendering, each chart independently fetches monthly pricing data rather than relying on a single cached dataset.
How to start backtesting a portfolio
Step 1: Configure portfolio settings
- Navigate to the data sheet and locate the user input section.
- Enter the portfolio name, benchmark ticker, start date, and end date.
- Define initial capital, rebalancing frequency, and contribution rules.
- Specify your preferences for handling dividends and capital gains.
Step 2: Assign asset allocations
- Locate the asset allocations table under the user input section on the data sheet.
- Enter the portfolio name to link the assets to your previously defined settings.
- Add the asset tickers and their corresponding target allocation percentages.
- Check the allocation status calculator to ensure total weights equal exactly 100 percent.
Step 3: Analyze the dashboard
- Switch to the dashboard sheet to view your results.
- Select your target portfolio from the primary dropdown menu.
- Select your preferred categorization grouping, such as asset class.
- Review the auto-generated scorecards and interactive charts to evaluate performance, turning your static stock tracking spreadsheet into a robust analytical platform.
Key metrics and visualizations included
- Scorecards displaying the compound annual growth rate, annualized volatility, Sharpe ratio, and maximum drawdown.
- An asset allocation donut chart that displays portfolio weights based on the selected categorization grouping.
- A portfolio growth chart comparing cumulative portfolio growth against the selected benchmark.
- A drawdown chart plotting peak-to-trough percentage drawdowns over the backtest period.
- An annual returns bar chart showing grouped yearly performance.
- A monthly returns heatmap displaying a year-by-month grid with a diverging color scale.
Who this portfolio backtest is for
- Retail investors looking to upgrade their stock portfolio tracking spreadsheet to analyze the historical performance of different asset allocation strategies.
- Financial analysts building a custom python stock tracker to model complex scenarios and visualize historical performance.
- Wealth managers comparing client portfolios against standard market benchmarks.
Use Quadratic to run a portfolio backtest
- Evaluate the historical performance of custom asset allocations against a target benchmark.
- Calculate key risk and return metrics, including compound annual growth rate, annualized volatility, Sharpe ratio, and maximum drawdown.
- Build interactive dashboards featuring asset allocation donut charts, cumulative growth comparisons, and monthly return heatmaps.
- Model advanced scenarios such as dividend reinvestment, custom contribution schedules, and different rebalancing frequencies.
- Leverage native Python to automatically fetch historical pricing data and run computations directly in the spreadsheet grid.
Related templates
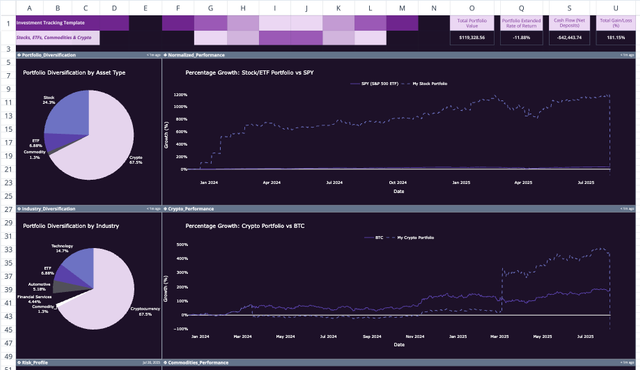
Investment Tracking Spreadsheet Template
Upgrade your investment management with advanced analytics.
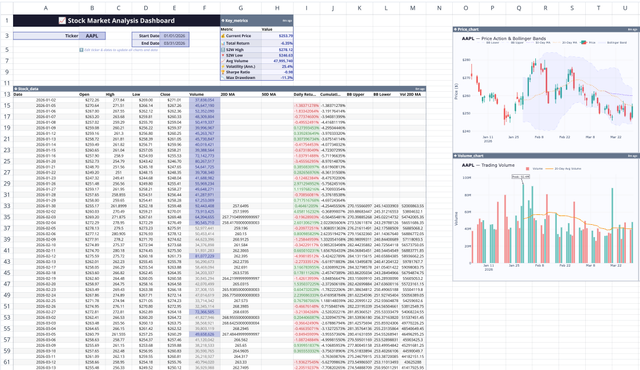
Stock Market Analysis Template
Study the markets with an interactive spreadsheet tracking any publicly traded company.
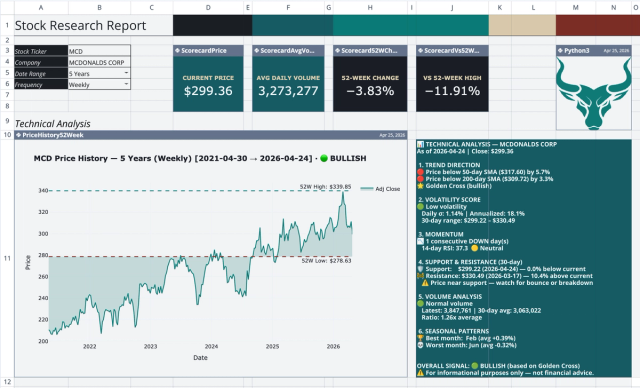
Stock Research Report Template: Live Stock Dashboard
Analyze a single stock's financial performance and risk.
