
Table of contents
- What effective microfinance management requires
- The core components of a microfinance performance evaluation framework
- Where traditional spreadsheet-based evaluation breaks down
- A real workflow: evaluating program performance in Quadratic
- Best practices for ongoing microfinance risk management
- Rethinking the tools behind microfinance management
- Conclusion: from static reports to reliable, adaptive evaluation
Every microfinance analyst reaches the same breaking point eventually. The spreadsheet that once tracked a handful of lending programs now spans dozens of tabs, hundreds of formulas, and data pulled from sources that never quite fit together cleanly. Member profiles live in one file, transaction histories in another, loan account details in a third, and somewhere in the mix, geographic data that's supposed to tie it all together.
Effective microfinance management depends on getting this right. Programs need to be evaluated rigorously, categorized accurately, and monitored continuously, but the tools most analysts rely on to do this work were never designed for datasets this interconnected or this dynamic. This article walks through what a sound evaluation framework actually requires, where spreadsheet-based approaches tend to break down, and how one analyst's real workflow in Quadratic shows a more resilient way to handle the complexity.
What effective microfinance management requires
Microfinance management, in the context of program evaluation, is broader than day-to-day loan servicing. It's the ongoing discipline of assessing whether community-based lending and savings programs are financially healthy, operationally sound, and delivering on their mission. That means looking past individual loan performance and asking a bigger question: is this program, as a whole, working?
Answering that question requires pulling together several categories of data that rarely originate from the same source. Member profiles capture who is participating in a program and their demographic context. Transaction histories show the day-to-day movement of funds, deposits, withdrawals, repayments. Loan accounts track balances, terms, and repayment schedules. Program details define the structure and rules a given initiative operates under. Geographic data adds regional context that often explains performance variance that would otherwise look like noise.
A microfinance management system, whether it's a purpose-built platform or a set of interconnected spreadsheets, exists to bring these pieces together into something usable. The end goal of evaluation is typically categorical: does a program get approved to continue as-is, flagged for review, or rejected because performance has fallen below acceptable thresholds? Layered on top of that categorization is the more nuanced task of identifying specific areas for improvement, whether that's a particular region underperforming or a member segment showing early signs of repayment stress.
The core components of a microfinance performance evaluation framework
Before any evaluation can happen, an analyst needs a framework that's both rigorous enough to catch real problems and standardized enough to apply consistently across programs that may look very different from one another.
Key metrics and data points
Most evaluation frameworks converge on a similar set of indicators, even if the specific thresholds vary by institution. Portfolio quality metrics sit at the center: repayment rates, delinquency percentages, and portfolio-at-risk (PAR) figures that reveal how much of the loan book is in danger of default. These numbers are the clearest signal of program health, but they mean little without context.
That context comes from member and demographic segmentation. Two programs with identical repayment rates can tell very different stories depending on the income levels, occupations, or household structures of the members they serve. Program-level financial health indicators, things like operational sustainability ratios and cost-per-borrower figures, add another layer, showing whether a program can support itself financially over time. Geographic performance variance rounds out the picture, often surfacing regional patterns tied to local economic conditions, seasonal cycles, or infrastructure gaps that wouldn't be visible in aggregate numbers alone.
Together, these data points form the backbone of microfinance risk management: the ongoing effort to identify which programs, regions, or member segments carry elevated risk before that risk turns into losses.
Structuring the evaluation model
Having the right metrics is only half the job. The other half is structuring them into a model that's consistent, transparent, and flexible enough to hold up under scrutiny.
Standardization matters most when comparing programs against each other. If one program's repayment rate is calculated on a 30-day window and another's on a 90-day window, any comparison between them is misleading. A well-structured evaluation model applies the same calculation logic everywhere, and just as importantly, documents that logic so anyone reviewing the report understands exactly how each figure was derived.
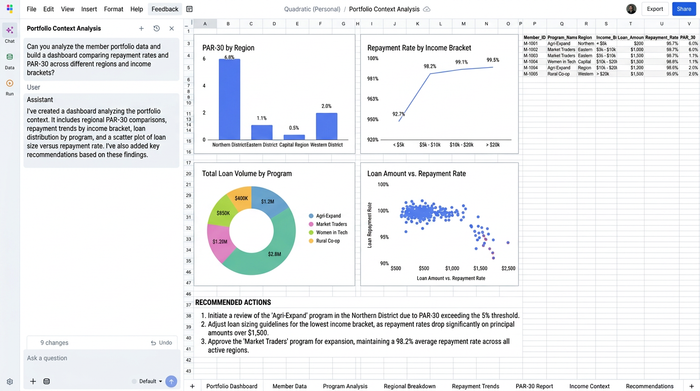
Assumptions need the same clarity. Interest calculation methods, risk weighting schemes, and the specific thresholds that separate an "approve" outcome from a "review" outcome should all be stated explicitly, not buried inside a formula that only the original analyst understands without an Excel formula explainer. A loan management system for microfinance, whether built as custom software or assembled from spreadsheets, is only as trustworthy as the transparency of its underlying assumptions.
Finally, a good model builds in scenario flexibility. What happens to program categorization if repayment rates dip by five points? What changes when a new program with limited historical data gets added to the evaluation? A framework that can only produce one static answer isn't really a framework, it's a snapshot.
Where traditional spreadsheet-based evaluation breaks down
This is the part every analyst who has done this work recognizes immediately, often with a slight wince. The framework above is well understood across the microfinance sector. The harder problem is executing it reliably, month after month, in a tool that wasn't built for datasets this interconnected.
Spreadsheet fragility is the first and most familiar issue. When program categorization depends on formulas that reference loan data, which references transaction data, which references member data, a single broken cell reference can silently corrupt an entire evaluation without triggering any visible error. The spreadsheet still looks fine. The numbers are just wrong.
Schema and data structure changes compound the problem. In microfinance data specifically, this isn't a rare edge case, it's a constant. A new column gets added to a loan export. A field that used to be labeled "region" gets renamed to "district" after an internal reorganization. A source file that used to come in as a flat CSV now arrives with a nested structure. Each of these changes has the potential to break every downstream formula that assumed the old structure would hold.
Manual error compounds further still. Categorization logic that sorts programs into approve, review, or reject buckets often depends on chained conditional formulas. When one link in that chain breaks silently, and it often does, an entire batch of programs can be miscategorized without any obvious warning sign.
And then there's the data source diversity problem. Combining member profiles, transaction histories, program details, and geographic data typically means manual joins, layers of VLOOKUPs to connect spreadsheets in Excel, or Power Query pipelines that are powerful in theory but brittle in practice. Each additional data source is another opportunity for a mismatched key, a misaligned row, or a join that quietly drops records nobody notices until the report is already out the door.
This is the spreadsheet risk problem that shows up again and again in institutional guidance on microfinance loan management software, usually followed by advice to "double-check your formulas" or "build in error checks." That advice isn't wrong, but it treats the symptom rather than the cause. This is where the workflow looks different when built in Quadratic.
A real workflow: evaluating program performance in Quadratic
An analyst working on exactly this kind of evaluation offers a useful case study, not as a hypothetical, but as a description of how the work actually happened.
Bringing together diverse, disconnected data
The starting point looked familiar: member profiles, transaction histories, loan accounts, program details, and geographic data, each living as its own dataset with its own structure, often resembling a messy Excel sheet. Rather than stitching these together through a chain of manual joins or an external ETL process, the analyst brought each dataset directly into Quadratic's grid.
Because Quadratic supports Python and SQL alongside traditional formulas in the same canvas, combining these sources didn't require exporting to a separate tool to clean messy spreadsheet data and re-importing the results. The datasets could be cleaned, joined, and reshaped using code where that made sense, and formulas where that was simpler, all within the same file. That combination mattered here specifically because microfinance data rarely arrives in a uniform format, and forcing every join through formulas alone tends to be exactly where fragility creeps in.
Building the evaluation logic
With the datasets connected, the real work began: calculating the metrics that would ultimately categorize each program as approve, review, or reject. This meant computing portfolio quality indicators from transaction and loan data, layering in member segmentation, and cross-referencing geographic performance, all logic that touched multiple interconnected datasets at once.
The key requirement here was calculation integrity. As the evaluation logic grew more complex, incorporating more conditions, more thresholds, and more cross-references between datasets, the underlying calculations needed to remain traceable and correct. Using Python as an alternative to VBA for the more involved logic meant the analyst could write evaluation rules that were explicit and inspectable, rather than buried inside a nest of spreadsheet formulas referencing other formulas referencing other formulas. When something needed to be checked, it was clear what the logic was actually doing.
Adapting to evolving data structures
This is where the workflow diverged most clearly from a traditional spreadsheet approach. Partway through the evaluation process, the underlying data structure changed, a new field appeared, a schema shifted, source data came in shaped differently than before. This is the exact scenario that tends to break spreadsheet-based evaluations: a renamed column here, a restructured export there, and suddenly formulas that referenced specific cells or ranges are pulling the wrong values, if they pull anything at all.
In Quadratic, adapting to that change meant adjusting the data ingestion and transformation logic directly, rather than manually chasing down every downstream formula that might have been affected. Because the data processing and the evaluation logic weren't tangled together in a single fragile chain of cell references, a change to the input structure didn't cascade into silent failures across the rest of the report. The evaluation logic kept working because it wasn't built on assumptions about exact cell positions in the first place, it was built on the shape and meaning of the data itself.
This is the practical resolution to the schema-change problem that spreadsheet guides typically only warn about. Rather than mitigating the risk of a broken reference, the workflow simply didn't depend on the kind of rigid structure that breaks in the first place.
Producing the final evaluation report
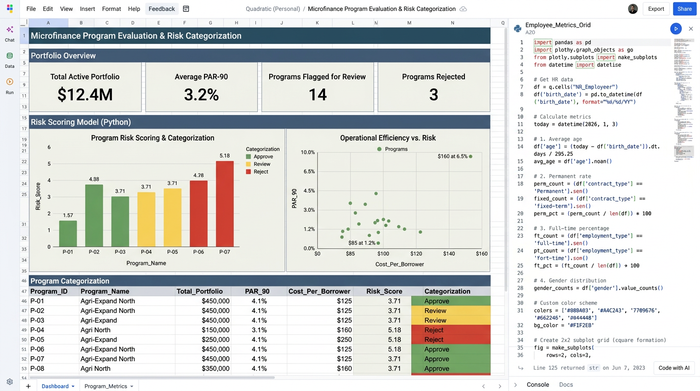
The end result was a comprehensive report categorizing each program by outcome, approve, review, or reject, alongside specific flags for areas that needed attention: a region with rising delinquency, a member segment showing early repayment stress, a program whose operational costs had crept upward relative to its portfolio size.
Just as important as the report itself was its reproducibility. Because the evaluation logic lived in a workflow rather than a one-time calculation, the same report could be regenerated as new data came in, without the analyst needing to manually rebuild formulas or re-verify every reference. That reliability, the confidence that running the report again next month would produce a correct and comparable result, is arguably the most underrated outcome of the entire process.
Best practices for ongoing microfinance risk management
The workflow above reflects a set of principles that apply broadly to microfinance risk management, regardless of what tool an analyst is using. A few stand out as worth adopting deliberately.
Standardize data structures across programs before evaluation begins. Comparability depends on it, and retrofitting standardization after the fact is far more painful than establishing it upfront.
Document assumptions behind every calculated metric. Interest calculation methods, risk weightings, and categorization thresholds should be written down somewhere a reviewer can find them, not left implicit in a formula.
Build evaluation logic that tolerates schema changes, not just accommodates them once. A fix that only works until the next data structure shift isn't really a fix.
Separate data ingestion from calculation logic. When these two layers are distinct, an error in one is far easier to isolate without tearing apart the other.
Run scenario checks regularly, not just at report time. Testing how categorization outcomes shift under different repayment or risk assumptions should be a routine exercise, not a one-off stress test.
Treat categorization thresholds as living parameters, not hardcoded values. As portfolios grow and market conditions shift, the line between "approve" and "review" may need to move too.
Prioritize reproducibility above all. Anyone on the team should be able to regenerate the same report from updated data and trust the result without needing to reverse-engineer the original analyst's process.
Rethinking the tools behind microfinance management
The fragility problems described earlier, schema changes that cascade into broken formulas, calculation integrity that erodes as complexity grows, data source diversity that forces brittle manual joins, aren't really user error. They're structural limitations of tools that were designed for simpler, more static datasets than the ones microfinance analysts work with today.
A workflow like the one described above isn't a rejection of spreadsheet thinking. It's an evolution of it. The grid, the familiar rows and columns, the intuitive cell-based mental model, remains. What changes is what sits underneath a modern Python spreadsheet: native support for Python and SQL alongside formulas, direct connections to live data sources, and evaluation logic that's built around the meaning of the data rather than its exact position in a file.
As MFI data continues to grow more complex, more sources, more programs, more frequent schema changes, the tools analysts rely on need to keep pace with the sophistication of the frameworks they're already using. Microfinance management software has to evolve alongside microfinance management practice, not lag behind it.
Conclusion: from static reports to reliable, adaptive evaluation
Strong microfinance program evaluation has never really suffered from a lack of frameworks. Portfolio quality metrics, risk weighting, categorization thresholds, these are well documented across the sector. What separates a reliable evaluation process from a fragile one isn't the framework itself, it's whether the underlying workflow can survive contact with real-world data complexity: the schema that changes without warning, the new data source that needs to be folded in, the calculation chain that has to stay correct even as it grows more elaborate.
The next time a data structure shifts underneath your evaluation, or a new program needs to be folded into a report that's already stretched thin, it's worth asking how your current workflow would hold up. If the honest answer involves crossed fingers, it may be time to look at how that same evaluation could work in Quadratic.
Use Quadratic to streamline microfinance management
- Connect disparate data sources: Combine member profiles, transaction histories, loan balances, and geographic data on a single canvas using direct database connections, avoiding fragile manual joins.
- Build transparent evaluation logic: Write clear, inspectable Python code for complex calculations like portfolio-at-risk and operational sustainability ratios instead of nesting fragile, hard-to-audit spreadsheet formulas.
- Adapt to shifting schemas: Handle changes in data structures or renamed columns by adjusting your data transformation logic directly, preventing silent calculation errors from cascading through your report.
- Automate monthly reporting: Create repeatable workflows that run automatically when new loan and transaction data arrives, ensuring your program evaluations are always up to date without manual rebuilding.
- Collaborate in real time: Work alongside risk managers and field teams in a shared, browser-based grid to align on program categorizations and risk assumptions.
Ready to build a more resilient evaluation model for your lending programs? Sign up today to Try Quadratic
