What you’ll get
- Health summary table
- Monthly financial trend chart
- Working capital chart
- Plain-language analysis
What this business health check tool does
This recipe builds a Monthly Business Health Snapshot dashboard that provides a compact, decision-useful view of your company's financial standing. It serves as an automated business health check, eliminating the need to manually compile reports from multiple accounting screens, a task often streamlined by financial reconciliation tools.
By bringing revenue, expenses, net income, cash, accounts receivable, and accounts payable into a single view, the tool makes it easy to monitor financial performance, which is a core application of financial data analytics. The workflow also analyzes recent financial changes, opportunities, and risks in plain language, giving operators an immediate understanding of their current financial position, which can then be used to build a financial forecast template.
Data used by the recipe
This workflow requires an active QuickBooks connection to run. It pulls raw accounting and transaction data directly from your synced tables to build the dashboard, enabling robust transaction tracking.
- Revenue: Pulls from source tables covering invoices and sales receipts to track incoming money.
- Expenses: Uses connection tables for purchases and bills to calculate outgoing costs.
- Cash: Retrieves current account balances from checking, savings, and undeposited funds.
- Working capital: Queries open receivables and open payables to track unpaid invoices and outstanding bills.
How to do a business health check with this workflow
The recipe begins by inspecting your QuickBooks schema to locate the most reliable tables for revenue, expenses, and balances. It assesses the available transaction history to determine date coverage and checks overall data quality before proceeding.
Inside the spreadsheet, the workflow creates an interactive dashboard controls section with editable start and end date cells, effectively turning it into an advanced accounting spreadsheet. It also generates a filters and assumptions block documenting the active connection and the applied date range. This section notes important accounting caveats, such as clarifying if gross profit is unavailable due to missing cost-of-goods-sold data in the synced dataset, and that net income is derived as revenue minus expenses rather than pulled from a native profit-and-loss report, which is a key component of robust financial reporting.
Next, the recipe queries four reusable source tables for monthly transactions, account balances, open invoices, and open bills. Finally, it uses Python code cells to filter these source tables based on your dashboard date controls and generate the final report.
Outputs generated by this business health check template
Running this recipe creates a structured, readable dashboard directly in your grid. The outputs include:
- Health Summary table: Displays total revenue, total expenses, net income, cash balance, accounts receivable, accounts payable, and open invoice and bill counts.
- Monthly Detail table: Breaks out revenue, expenses, and derived net income by month.
- Financial trend chart: A grouped bar chart with a line overlay showing the monthly financial trajectory over the selected date range.
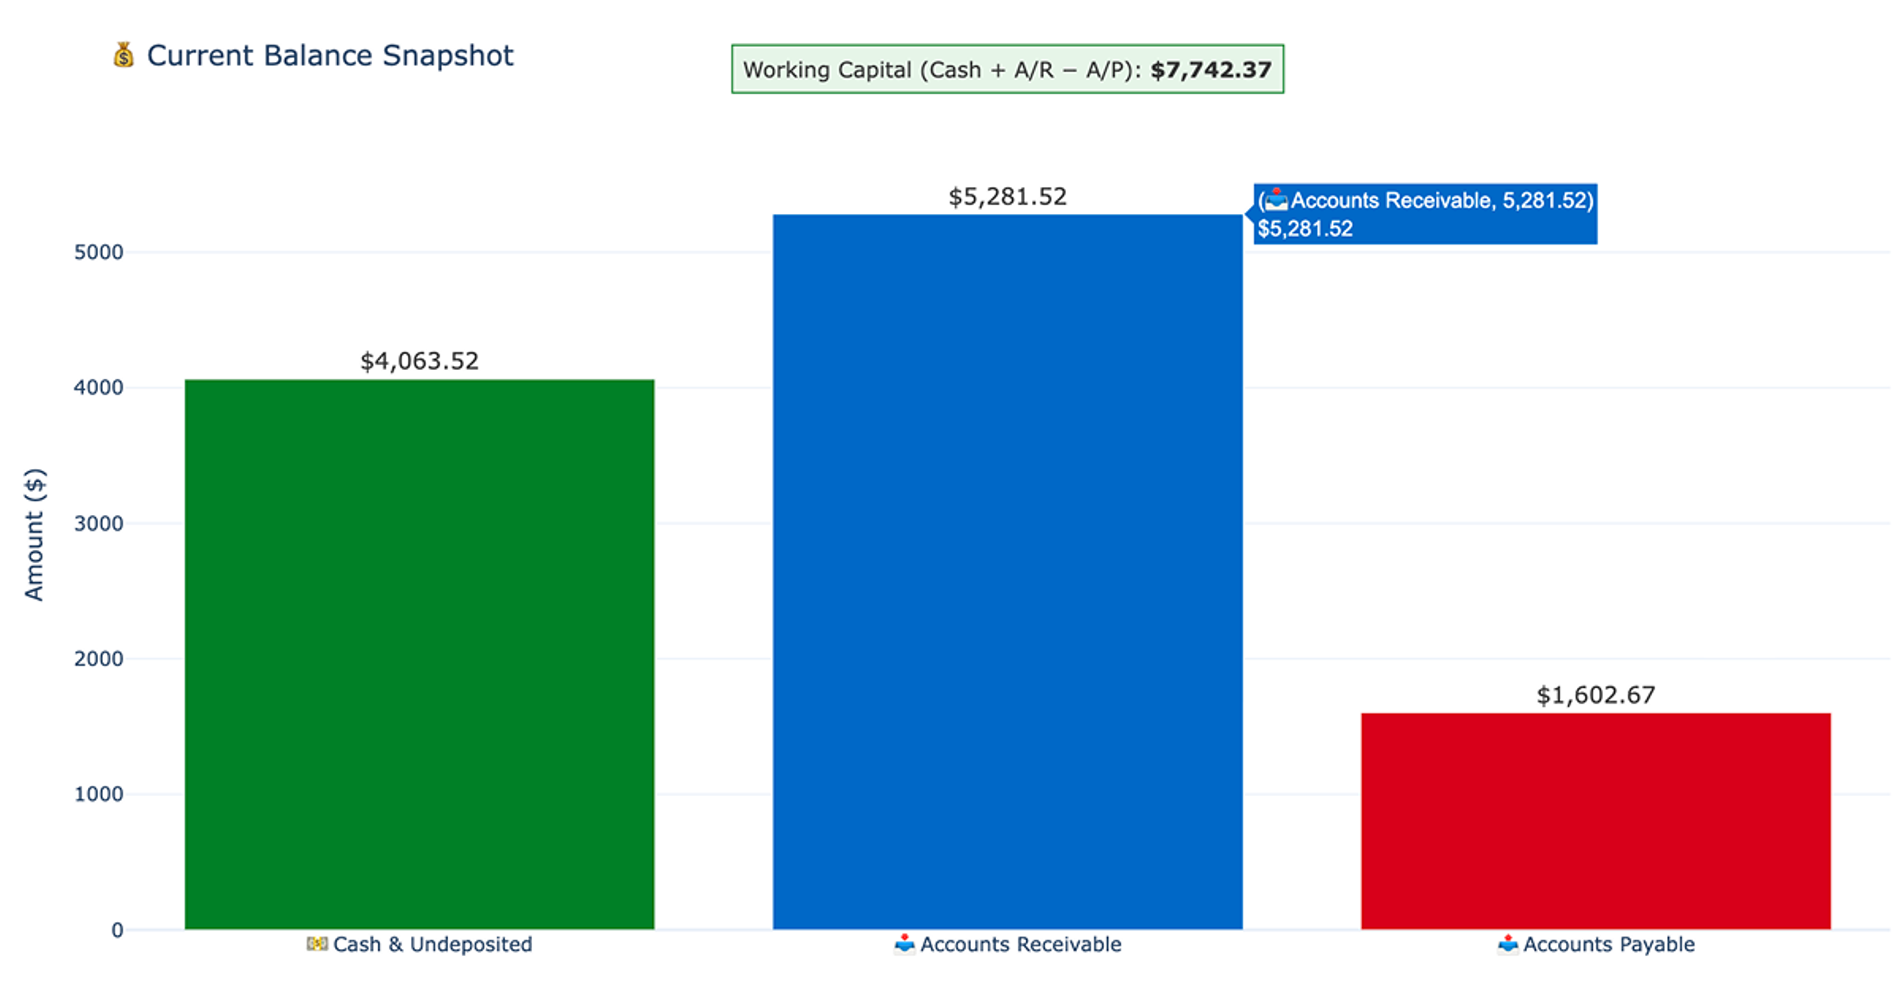
- Working capital chart: A horizontal bar chart comparing cash, accounts receivable, and accounts payable with a working capital annotation.
- Recent changes analysis: A plain-language summary comparing the most recent full month to the prior month for revenue, expenses, and net income trends.
- Opportunities and risks: A plain-language breakdown flagging critical items, such as accounts receivable exceeding cash, along with specific data caveats.
Optional metric drilldowns
After the main dashboard is built, the recipe supports a single optional follow-up path to analyze specific metrics in more detail. Where the schema allows, you can select one of six metrics to investigate: Revenue, Expenses, Net Income, Cash, Accounts Receivable, or Accounts Payable.
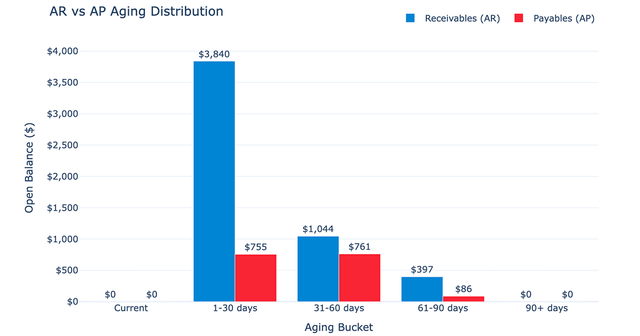
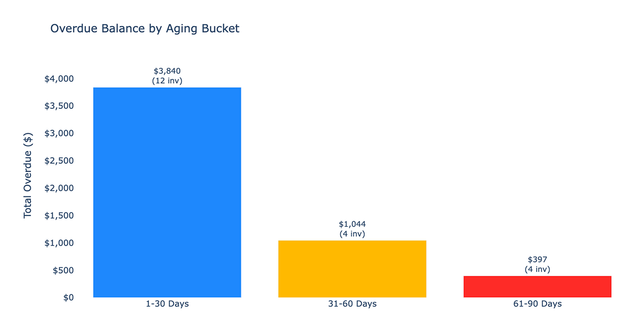
If Accounts Receivable is selected, the recipe runs a dedicated drilldown. This produces a customer concentration table sorted by balance, complete with aging, invoice count, and the percentage of total accounts receivable. It also generates a dual-panel chart combining an aging bucket bar chart with a customer concentration donut chart to help visualize outstanding payments.
Who this business health check recipe is for
This recipe is designed for professionals who need a reliable, high-level view of their company's finances without manual data wrangling. It is ideal for:
- Business operators who want a clear summary of financial risks and opportunities without building complex accounting models.
- Finance teams needing a quick, reliable starting point to review monthly financial performance.
- Users looking for an automated business process health check to monitor working capital and cash flow trends.
- Analysts who require a structured baseline before diving into deeper investigations of accounts receivable or expense drivers.