What you’ll get
- Channel summary table
- Recent channel movers table
- Engagement and key event chart
- Opportunities and callouts
- Plain-language takeaways summary
What this quality vs quantity traffic recipe does
This recipe builds an automated google analytics spreadsheet dashboard to evaluate your marketing channels based on both traffic volume and actual user engagement. Rather than looking at clicks alone, it compares session counts against engagement rates and key event metrics to reveal the true value of your inbound traffic.
The analysis identifies high-performing sources, hidden gem channels with strong engagement at a modest scale, and low-quality traffic buckets that may be wasting resources. It also highlights recent growth or decline trends across different channels, similar to an ai dashboard ga4 for proactive insights. Finally, it provides an optional drilldown to analyze specific channels by landing page to see exactly where your best traffic is arriving.
What connected data it uses
This recipe requires a live Google Analytics 4 connection. It uses raw data from your traffic acquisition source table as the primary input for the analysis.
To categorize your traffic, the workflow relies on the default channel grouping dimension. It pulls volume metrics including total sessions alongside quality metrics like engaged sessions, event counts, key events, and user engagement duration. The recipe also uses your pages source table to identify hostnames and support the optional landing page drilldown.
How the workflow progresses
Discovery and setup
The recipe begins by inspecting your Google Analytics connection to confirm the required tables and metrics are available. It estimates the available date range for your historical data and checks the pages table for multiple distinct hostnames. If multiple web properties exist, the workflow pauses to ask for a hostname selection. This choice is saved for later context without restricting the primary channel data.
Dashboard generation
Next, the recipe performs an export google analytics data operation, extracting all available historical channel data into a foundational base table without hardcoding date limits. It places editable start and end date controls directly on the spreadsheet, defaulting to the last 90 days. The workflow then calculates channel summaries and recent movement trends based on these active date controls, generating marketing data visualization charts and plain-text summaries of the findings.
Optional landing page drilldown
After the main dashboard is built, the recipe offers a follow-up option to investigate a specific channel of your choice. If triggered, it filters the pages table by the selected channel and your previously chosen hostname. This produces a ranked breakdown of the landing pages driving that specific channel's traffic where the schema allows.
What outputs it creates
The recipe generates a complete, interactive custom dashboard google analytics directly in your spreadsheet. The specific outputs include:
- A control panel with adjustable start and end dates and a summary of active filters
- A channel summary table detailing sessions, engagement rates, events per session, and key event rates
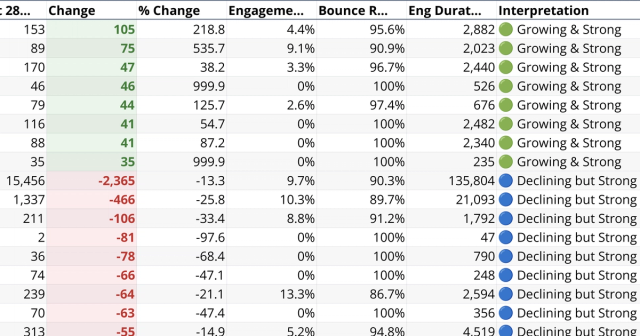
- A recent channel movers table comparing the last 28 days to the prior 28 days to show absolute and percentage changes
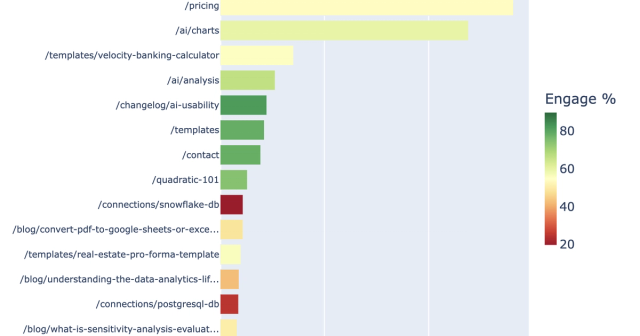
- A horizontal bar chart ranking channels by overall session volume
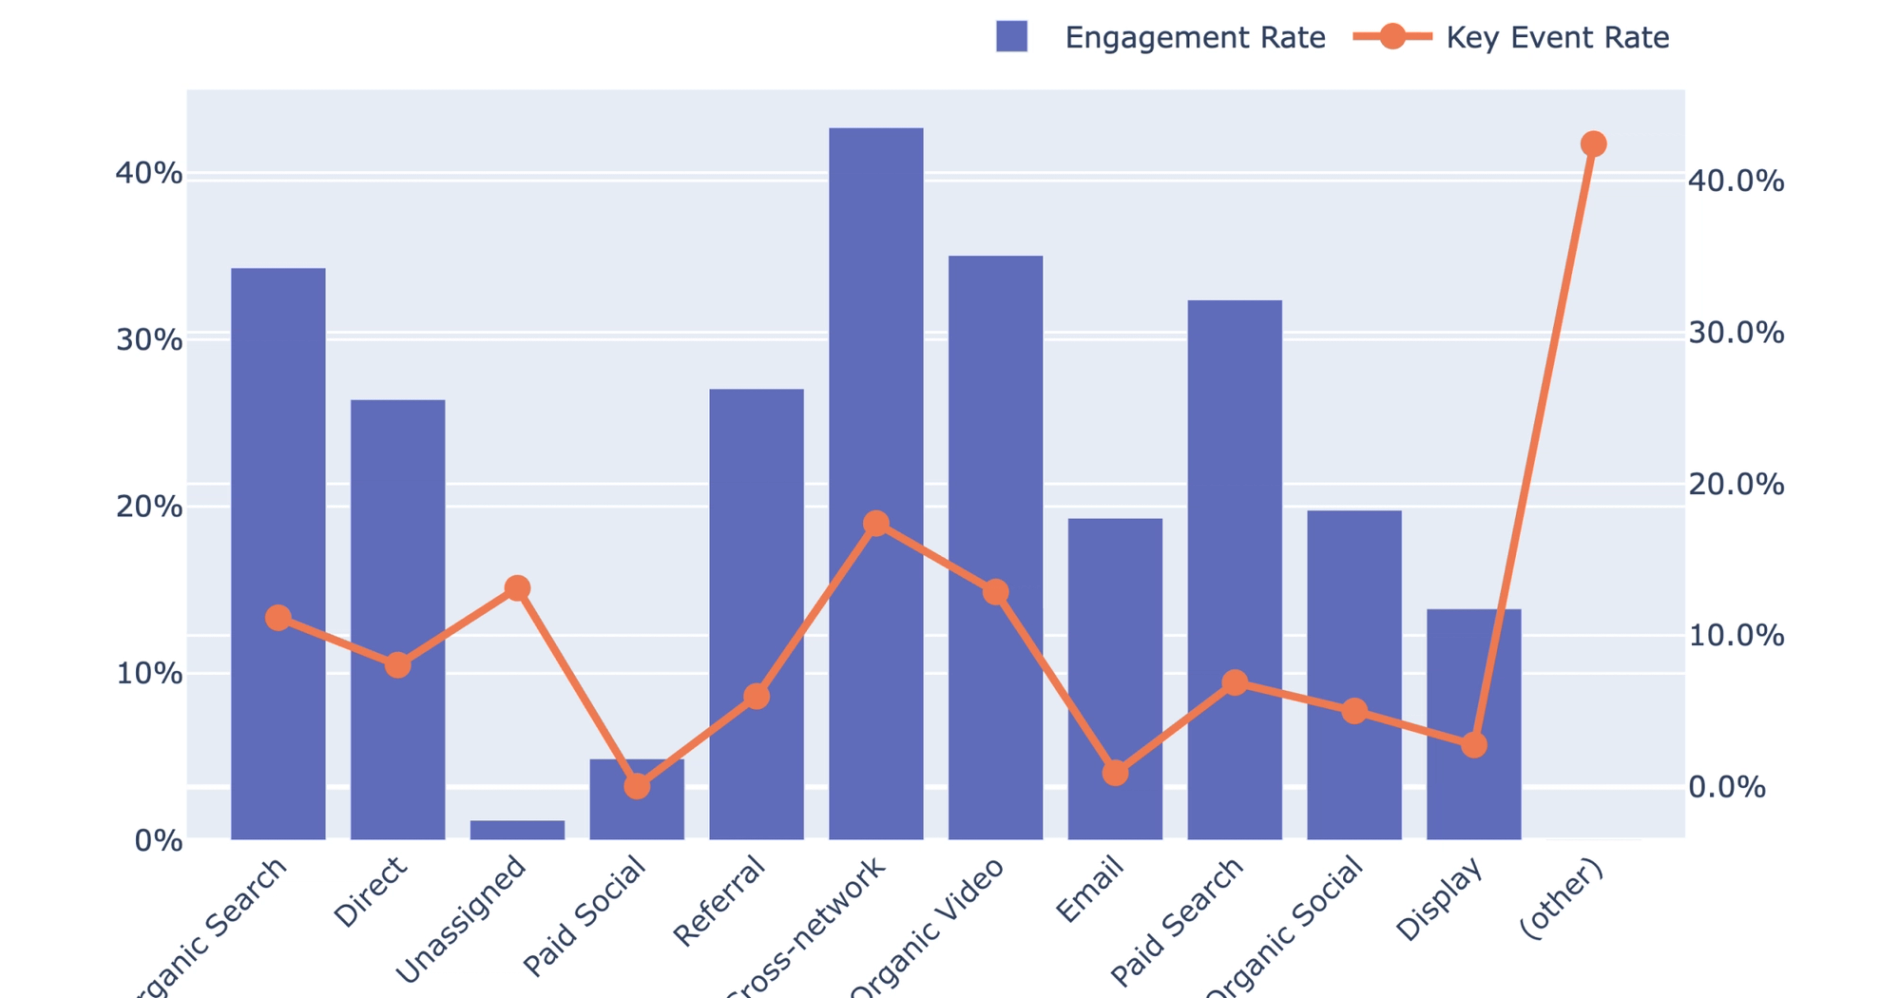
- A dual-axis chart comparing engagement rates and key event rates for your top channels
- A plain-text callouts section highlighting patterns like high-volume but low-quality sources
- A takeaway summary explaining what is working, what is underperforming, and recommended next steps
- An optional landing page table and chart if you choose to trigger the drilldown
Who this Quality vs Quantity Traffic by Channel recipe is for
This workflow is designed for teams that need to understand the real impact of their marketing efforts beyond basic visitor counts.
- Growth marketers needing to evaluate the actual value of their inbound traffic sources
- Web analysts looking to spot recent shifts in channel performance and user engagement
- Digital teams wanting to identify which marketing channels drive key events rather than just superficial clicks