What you’ll get
- Top 25 pages table
- Trend movers table
- Engagement opportunity callouts
- Plain-language insights
What this recipe does
This recipe evaluates GA4 traffic and engagement metrics for a user-selected hostname to help you understand how visitors interact with your site. It automatically highlights high-traffic low-engagement pages, declining URLs, and growing content, providing actionable insights for improving landing page performance.
To make the analysis easier to digest, it classifies your site content into logical groups for targeted analysis. This allows you to quickly identify the best performing landing page across your entire site or within specific collections.
What connected data it uses
To run this analysis, the recipe connects directly to your synced Google Analytics data.
- Synced Google Analytics connection
- Raw data from the pages connection table, often obtained by exporting Google Analytics data, is also utilized.
- Requires hostName and pagePath dimensions for filtering and classification
- Relies on standard traffic and engagement metrics including active users, engaged sessions, and engagement rate
- It utilizes session source and session medium dimensions for accurate metric aggregation, which are key components of GA4 default channel grouping.
How the landing page performance workflow progresses
Discovery and hostname selection
The workflow begins by profiling your pages source table to determine date coverage and available metrics. It calculates the traffic distribution across all available hostnames in your dataset and presents a ranked list of options. You simply select the hostname you want to analyze before the recipe builds the final report.
Core report build
Once a hostname is selected, the recipe filters the raw data to that specific site over the last 90 days, automatically excluding null and blank page paths from the analysis. It then calculates weighted engagement and bounce rates by deriving estimated total sessions.
The workflow aggregates site-wide metrics by week for trend analysis and compares the most recent 28-day period against the prior 28 days to identify trend movers. Finally, it classifies your pages into standard collections based on URL prefixes.
Optional collection drilldown
After the core report is complete, the recipe allows you to select a specific page collection from the summary. It then applies the exact same filtering, ranking, and period-comparison logic to the chosen path prefix, generating tailored insights specific to that collection.
What outputs it creates
The recipe generates a custom dashboard google analytics directly in your spreadsheet, including:
- Top 25 Pages SQL table ranked by active users with weighted engagement metrics
- Weekly trend SQL table aggregating active users and engagement rates
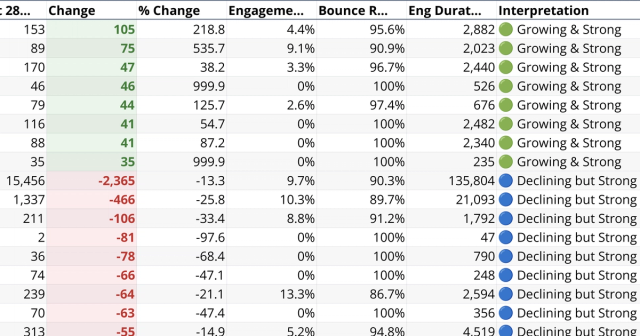
- Trend movers SQL table identifying the top 10 gainers and top 10 decliners by absolute change
- Collection summary SQL table grouping traffic and engagement by page type. These tables can easily be used to create a google analytics pivot table for further custom analysis.
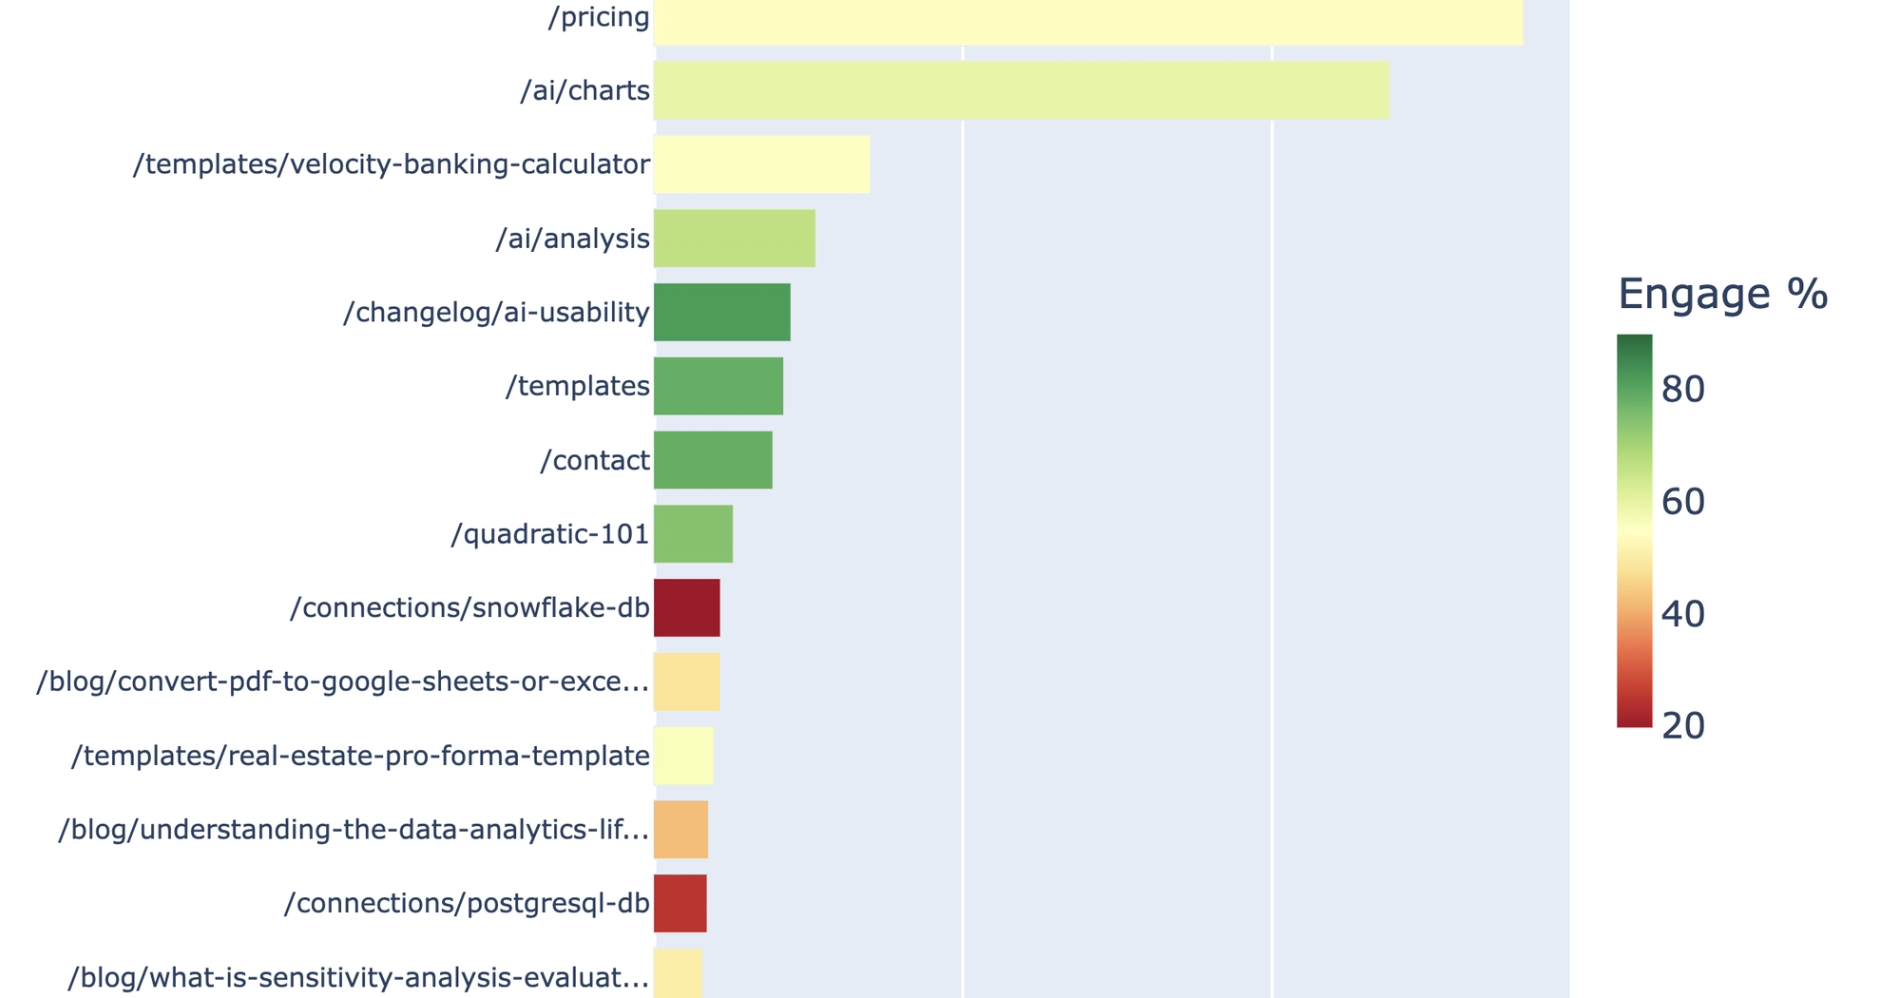
- Horizontal bar chart of top pages colored by engagement rate, with the homepage excluded for scale
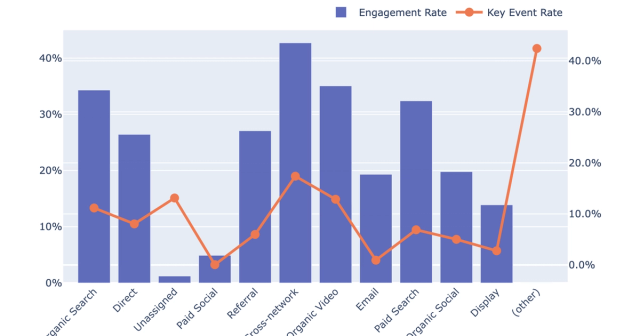
- Dual-axis weekly trend chart displaying active users as bars and engagement rate as a line overlay
- A plain-language insights section, similar to an AI dashboard GA4, details elements to improve landing page performance.
Who this Landing Page Performance Analysis recipe is for
- Growth marketers needing a comprehensive landing page performance report without manual google analytics spreadsheet formatting will find this recipe invaluable.
- This allows web analysts to track their best performing landing pages over time to monitor site health, often leveraging real-time google analytics data in microsoft excel for quick updates.
- Content teams comparing traffic and engagement across different site sections or blog categories
Related recipes
Quality vs Quantity Traffic by Channel
Evaluate channel traffic quality and engagement from connected GA4 data.
Web Page Engagement Dashboard
Compare GA4 page traffic changes with engagement quality.
Ecommerce Performance Analytics
Generate product and category performance insights from connected GA4 ecommerce data.