What you’ll get
- Product summary & opportunities table
- Category summary table
- Product revenue bar chart
- Plain-language takeaways
What this ecommerce performance analytics workflow does
This recipe produces a comprehensive product performance review to help you evaluate your overall catalog health. By analyzing your connected data, it quickly identifies the specific products and categories that drive the most revenue.
The workflow surfaces items with monetization or exposure issues to help you optimize your best performing ecommerce product pages. It also generates plain-language insights to guide your inventory and merchandising decisions without requiring manual data analysis.
Data sources and inputs for ecommerce performance analysis
This analysis requires a BigQuery-connected GA4 dataset. The recipe uses raw data from your selected connection, specifically targeting item-level ecommerce source tables to build its reports.
It relies on populated fields for item name, item category, items purchased, and item revenue. The workflow adapts gracefully to missing data. If funnel metrics are uniformly zero or if there are missing date columns, the recipe documents these gaps directly in the dashboard instead of fabricating analysis.
How the workflow progresses
The recipe begins with a discovery phase to inspect the GA4 schema and locate the best item-level data. It probes the connection tables for data quality to determine which metrics are reliably populated for analysis.
Next, it creates a dashboard controls section containing date input cells and a filters panel. It documents the primary product identifier used, available metrics, and all discovered data limitations directly in the dashboard so you know exactly what data is driving the results. To build the reports, it executes a source query to aggregate raw ecommerce data by product name and category. This step sums purchases and revenue, computes the average price per unit, and collapses duplicate rows for variants or list positions to ensure an accurate baseline.
What this recipe produces
- Builds a Product Summary table ranking the top thirty products by revenue, showing purchases, average price, and share percentages.
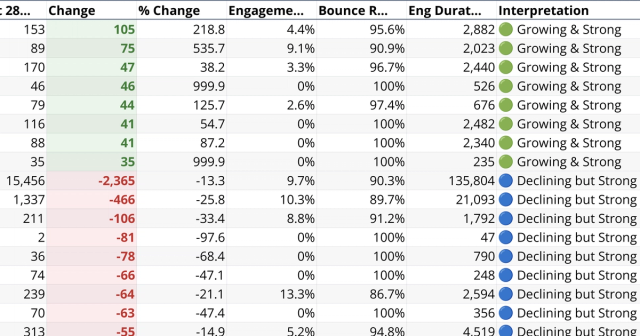
- Generates a Product Opportunities table segmenting items into labels like strong seller, underexposed winner, and low traction using threshold logic.
- Creates a Category Summary table aggregating metrics across the top fifteen categories by revenue.
- Writes a Key Insights section detailing total revenue, top five drivers, dominant categories, and flagged monetization issues.
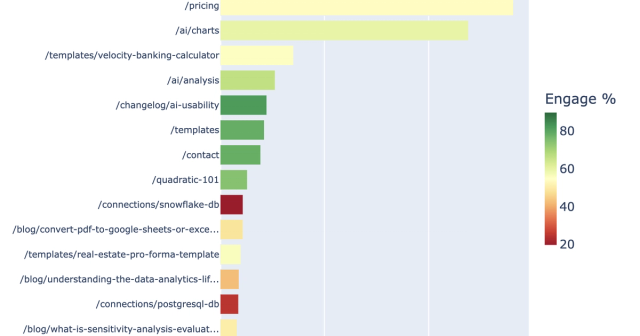
- Generates a horizontal bar chart ranking the top fifteen products by revenue.
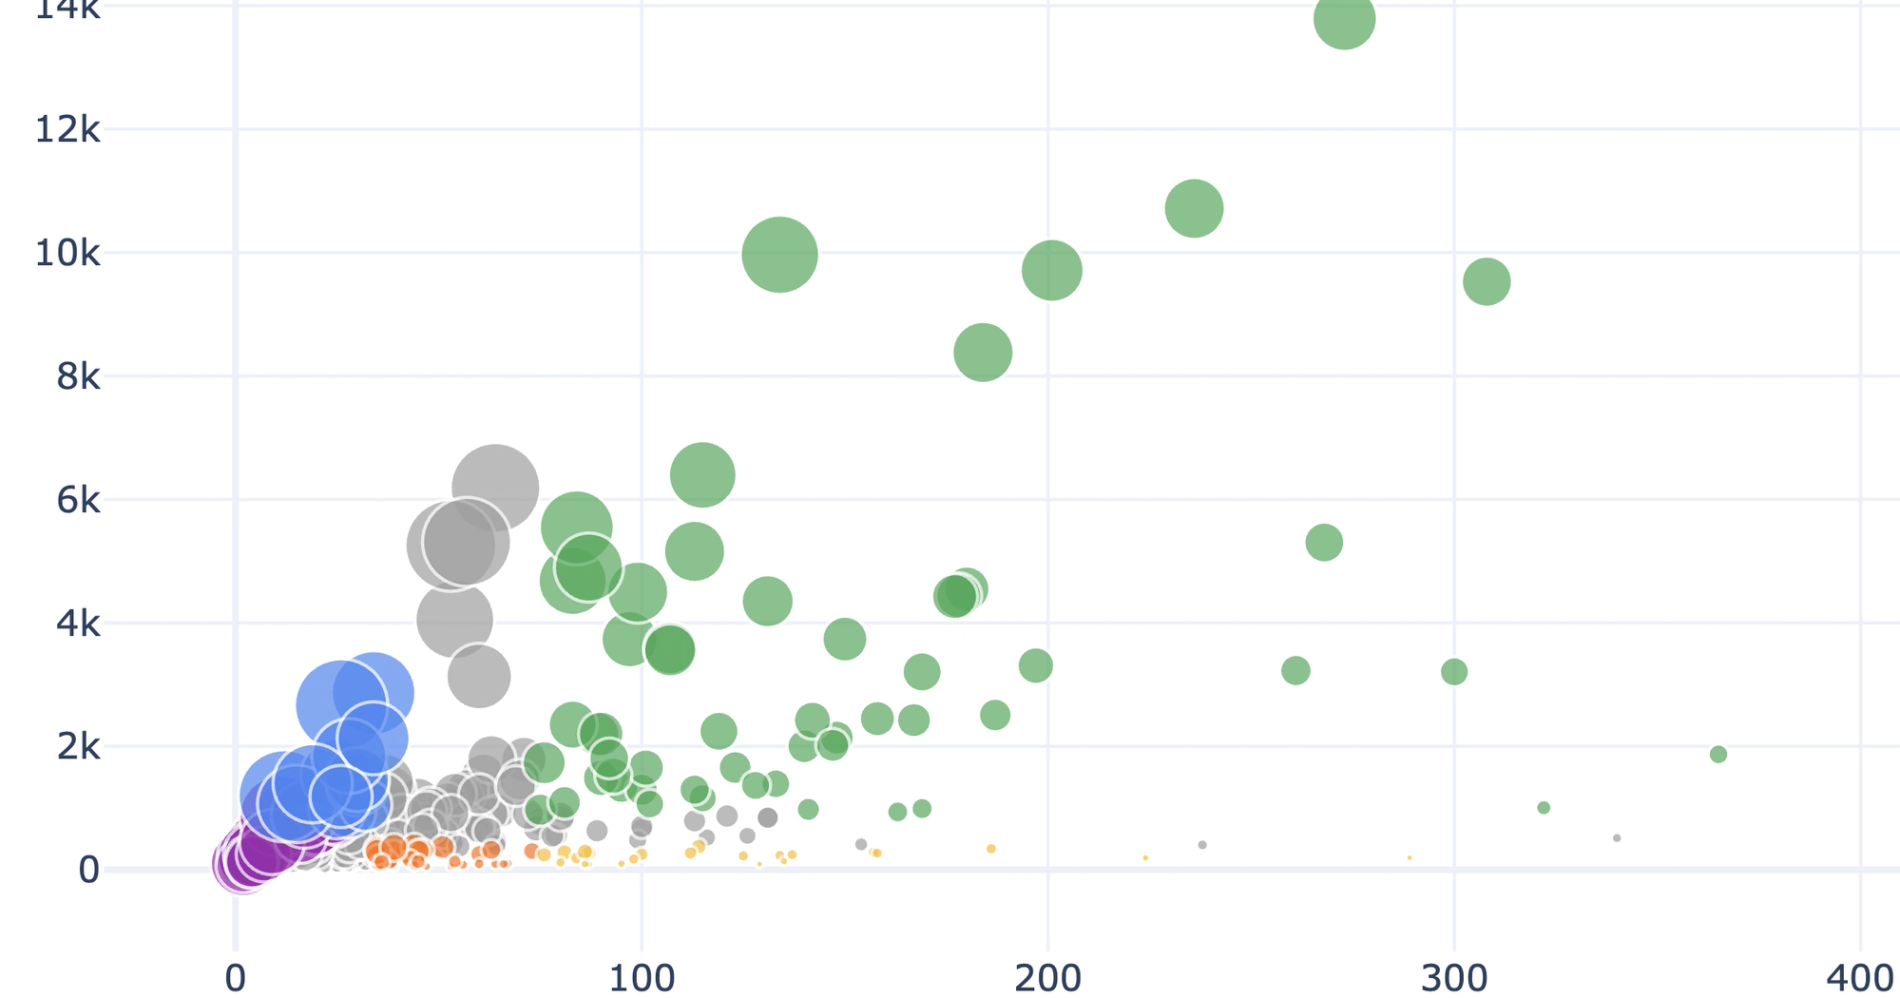
- Plots a scatter chart mapping purchases against revenue, with points colored by opportunity classification.
- Offers an optional drilldown path where users can name a specific product to receive a detailed category context and comparative positioning breakdown, where the schema allows.
Who this Ecommerce Performance Analytics recipe is for
- Ecommerce managers evaluating overall product catalog performance.
- Merchandising teams looking to identify underexposed winning products for better placement.
- Data analysts needing a quick, robust summary of GA4 item-level revenue without manual querying.
- Marketing teams optimizing campaign traffic toward high-converting or premium-priced items.