James Amoo, Community Partner
Apr 20, 2026

Lenders face rapidly shifting economic conditions that make the strategic management of distressed assets more critical than ever. To navigate these challenges, financial institutions rely on dedicated workout units to minimize losses and maximize recovery. These specialized teams require highly accurate data to make informed operational decisions.
Relying on manual financial reporting methods leaves credit teams reacting to stale data. A data-driven approach allows for continuous balance sheet monitoring and a faster data analytics strategy. The best analytics tools for NPL management, and for broader financial data analytics, are not just platforms for generating static reports. They are dynamic environments that enable teams to adapt their collection strategies as soon as borrower risk profiles change.
Key metrics and methodologies for NPL portfolios
Managing a distressed portfolio requires specific quantitative methodologies to measure and mitigate risk accurately, similar to the approaches used in accounts receivable analytics. The foundation of this analysis begins with tracking early-stage delinquency and calculating overall NPL ratios. These baseline metrics provide an immediate snapshot of portfolio health and indicate whether initial collection efforts are succeeding.
To gain deeper visibility, credit teams rely on roll rate analysis. This critical framework tracks exactly how loans transition between different delinquency buckets over time. By observing the percentage of accounts moving from 30 days past due to 60 days past due, operators can identify accelerating risk before it results in severe defaults.
Understanding these transitions is essential for forward-looking forecasting, a key component of predictive analytics. Accurately projecting potential financial impacts allows finance leaders to allocate appropriate reserves and guide targeted collection strategies.
Another essential layer of analysis involves segmentation and recovery performance tracking. By breaking down the NPL portfolio across dimensions such as borrower demographics, loan type, origination channel, and geographic region, credit teams can pinpoint where risk is most concentrated and which segments respond best to specific collection strategies. This enables teams to continuously refine their approach and maximize overall portfolio recovery while minimizing further losses.
Designing your NPL analytics workflow
Building a flexible and auditable data pipeline for distressed assets requires a solid data infrastructure and analytics strategy. A well-designed NPL analytics workflow ensures that teams can move efficiently from raw data to actionable insights, while maintaining transparency and traceability across every stage of the process. This is critical for supporting both day-to-day collection strategies and long-term risk management decisions.
The first step is establishing a centralized data exploration at the loan level. Relying on pre-aggregated summaries significantly limits analytical depth and restricts the ability to investigate specific risk drivers. By pulling raw data directly from databases and APIs, teams retain the granularity needed to perform detailed segmentation, identify anomalies, and build robust predictive models.
Once the data foundation is in place, the next phase involves segmentation and cohorting. Grouping loans based on attributes such as origination date, credit score, loan structure, or borrower profile enables more precise risk analysis. Techniques like vintage or cohort analysis allow teams to track how different groups of loans perform over time.
Finally, an effective workflow must incorporate strong operational feedback loops between analytics and collections teams. When credit operators have access to real-time insights, they can quickly adapt their strategies and deploy targeted interventions. This ensures that data-driven insights are not just theoretical but actively improve recovery outcomes and overall portfolio performance.
Evaluating the Best Analytics Tools for NPL Management
Selecting the right technology stack dictates how effectively your team can execute its risk strategies. Traditional spreadsheets like Excel and Google Sheets often serve as the default starting point, but they come with severe limitations for NPL management. As portfolios grow, these manual files struggle with scale and auditability. This creates a fragmented and error-prone reporting environment for finance teams.
On the other end of the spectrum, jumping straight to rigid BI tools or highly complex artificial intelligence implementations often creates technical bottlenecks. Finance operators find themselves relying on engineering teams to make simple changes to a dashboard.
The ideal solution lies in a modern middle ground. When evaluating the best analytics tools for NPL management, look for platforms that combine code-friendly data engineering capabilities with transparent interfaces. This empowers finance teams to build scalable data pipelines while maintaining the flexibility to explore data and adjust models on the fly.
Quadratic: Best NPL management analytics software
Managing non-performing loans (NPLs) requires continuous monitoring of borrower behavior and portfolio risk exposure across multiple systems. Traditional workflows often rely on fragmented tools and delayed reporting. Quadratic provides a unified analytics environment where financial institutions can centralize and operationalize their NPL management processes.
Direct connections to multiple data sources
Quadratic connects directly to databases, raw data, and financial APIs. This allows teams to ingest borrower data and risk indicators into a single workspace without manual intervention.
With unified data access, analysts can track the full lifecycle of each loan. This includes monitoring delinquency stages, restructuring activity, and recovery progress in one consolidated view.
AI-powered data analysis
Quadratic leverages AI to analyze borrower behavior and identify high-risk accounts. This includes detecting early warning signals such as missed payments or declining repayment capacity.
AI-driven insights help teams prioritize collection efforts and allocate resources more effectively. By automating pattern recognition, organizations can respond faster to emerging risks. Let’s see how it works using a sample dataset in Quadratic:
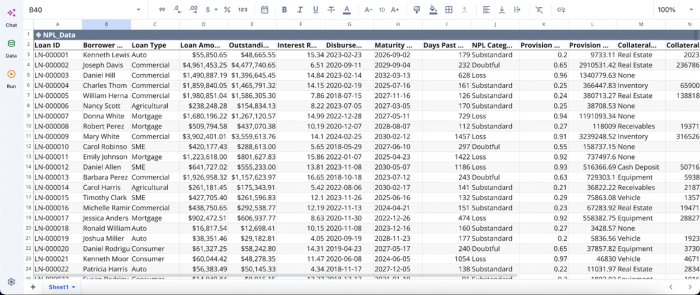
Once your data is in Quadratic (either via import or direct connection), you can immediately begin analysis. No extra setup is required. Here:
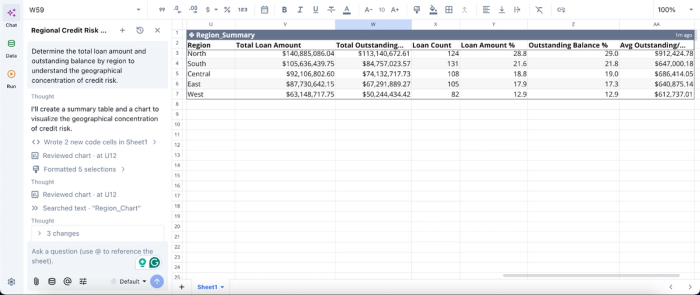
In this image, I ask Quadratic AI to “Determine the total loan amount and outstanding balance by region to understand the geographical concentration of credit risk.” Within seconds, it generates a structured summary table that aggregates key metrics, including total loan value, number of loans, and outstanding balances across each region.
AI data visualization for portfolio monitoring
Quadratic enables the creation of financial data visualization of key NPL metrics, such as delinquency rates and recovery trends. These dashboards update dynamically as new data is ingested.
Visualizations allow stakeholders to quickly assess portfolio health and track performance over time. This supports more informed decision-making at both operational and executive levels. Here’s how to create interactive visualizations by using text prompts in Quadratic:
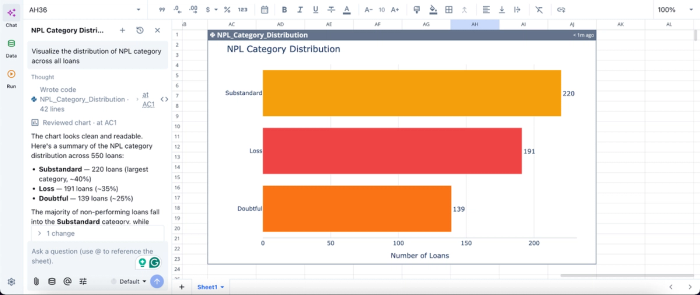
In this image, I ask Quadratic AI to “Visualize the distribution of NPL category across all loans.” In seconds, it generated a chart to display the NPL category distribution. By making these patterns visually obvious, teams can quickly assess the severity of their NPL exposure and prioritize intervention strategies for the most critical segments of the portfolio.
Native support for programming languages
With built-in Python, SQL data analytics, and spreadsheet formulas, Quadratic allows teams to implement advanced credit risk models and custom analytics. This includes calculating the probability of default and recovery forecasts.
This flexibility ensures that NPL analytics can be tailored to specific portfolio characteristics. Teams can continuously refine their models as new data becomes available.
Dynamic cohort tracking and roll rate analysis
Quadratic enables teams to define and track loan cohorts based on origination date, risk profile, or delinquency stage. This allows for more granular analysis of portfolio behavior over time.
By calculating dynamic roll rates within the same environment, teams can better understand how loans transition between delinquency buckets and adjust strategies accordingly.
Real-time collaboration
Quadratic supports collaboration between credit analysts, finance teams, and collections departments within a collaborative analytics platform. Everyone works on the same data and logic.
This collaborative approach improves coordination and accelerates decision-making. Teams can jointly investigate accounts, validate assumptions, and refine strategies in real time.
Conclusion: Iterate and automate your risk monitoring
Creating an effective strategy for the best analytics tools for NPL management requires blending robust loan segmentation and modern tooling. Managing non-performing loans is an iterative process rather than a one-time project. It requires automated monitoring to mitigate balance sheet risk and adapt to changing borrower behaviors.
By moving away from static files and rigid dashboards, finance teams can create a more agile and responsive data environment. Quadratic allows you to build transparent NPL dashboards and cohort analyses that your team can audit and iterate. Try Quadratic for free.
Frequently asked questions (FAQs)
What makes analytics tools essential for NPL management?
Analytics tools for NPL management are crucial for financial institutions to proactively monitor distressed assets and maximize recovery. They enable a data-driven approach that moves teams beyond manual reporting, providing dynamic data for continuous balance sheet monitoring and agile strategic adjustments.
How does Quadratic enhance NPL analytics workflows?
Quadratic provides a unique environment that combines a flexible spreadsheet grid with native Python and SQL, allowing finance teams to connect directly to live databases and APIs. This empowers analysts to define custom cohorts and calculate dynamic roll rates that are always up to date.
What are the common challenges with traditional analytics tools for NPL management?
Traditional spreadsheets often struggle with scale and auditability when managing growing NPL portfolios, leading to fragmented and error-prone reporting. Conversely, rigid business intelligence dashboards or complex AI implementations can create technical bottlenecks, slowing down finance teams' ability to adapt their strategies.