James Amoo, Community Partner
Apr 20, 2026

The restaurant industry operates on notoriously thin margins, where a slight increase in food costs or a minor miscalculation in labor scheduling can quickly erode profitability. To survive and scale, you need to protect every dollar. Building an analytics software for restaurants requires an active and repeatable workflow that continuously monitors your core margin drivers.
The best data analytics tools for restaurants, whether a dedicated budget app or spreadsheet, are the ones that facilitate this recurring cycle. They transform raw data from disparate systems into consistent insights, empowering operators across single and multi-location businesses to pinpoint and fix margin leaks.
The hidden cost of fragmented restaurant data
Relying solely on isolated POS analytics or high-level brand averages is a risky strategy. These fragmented views easily hide struggling locations and obscure real-time margin leaks. When your operational data lives in one system, and your financial data lives in another, getting a clear picture of true profitability becomes a painful process.
Traditionally, restaurants have relied on a delayed monthly financial reporting cycle. By the time the finance team finalizes the numbers, operators are reacting to problems that happened weeks ago. This delay leaves managers unable to make timely adjustments to purchasing or scheduling.
As restaurants scale into multi-unit operations, there’s a need for data blending and connecting these disparate systems into a single source of truth. Without it, a natural friction emerges between operations teams looking at front-of-house and back-of-house metrics, and finance teams looking at accounting data. When systems do not communicate, teams cannot collaborate effectively.
What your restaurant data analytics solutions must track
Before you can establish a routine, you need to know exactly what numbers matter. While many operators look for standard performance indicators, the most effective teams divide their focus clearly between front-of-house and back-of-house metrics, using them as the foundation for weekly operational reviews.
Back-of-house cost control metrics serve as your primary defense against shrinking margins. Tracking the difference between actual and theoretical food costs helps uncover inefficiencies such as waste, over-portioning, or inventory discrepancies. Alongside this, monitoring prime cost provides a high-level view of overall profitability. Keeping these figures within target ranges is essential for maintaining financial stability in a business with tight margins.
Front-of-house performance metrics, on the other hand, directly influence revenue and customer experience. Analyzing sales trends across different days and time periods helps you anticipate demand and plan accordingly. At the same time, monitoring labor as a percentage of sales ensures that staffing levels remain efficient without compromising service quality.
These metrics are decision-making tools. When reviewed consistently, they provide a clear picture of what is working and what needs adjustment. By tying these data points directly to operational actions, you create a restaurant data analytics strategy that supports both efficiency and long-term profitability.
Building a repeatable restaurant analytics workflow
Knowing your metrics is only half the battle. The major gap in how most operators approach their data is the lack of a structured process. Successful multi-location operators build human routines around their data.
To truly improve profitability, you must establish a recurring cycle of data exploration, analysis, and action. The technology you choose must support this recurring human workflow, rather than just acting as a static repository for numbers.
Step 1: Standardize data collection
The first step is pulling data from your disparate systems into a unified view.
If you operate multiple locations, consistent data formatting is non-negotiable. A menu item or labor code must be categorized the same way at location A as it is at location B. This ensures accurate reporting across the entire brand. Furthermore, standardizing your data collection eliminates stale data and sets the stage for spreadsheet automation.
Step 2: Define roles and responsibilities
Once your data is standardized, you must clarify who owns that data at each level of the business. Without clear ownership, teams suffer from data fatigue, assuming someone else is monitoring the metrics.
Assign specific responsibilities to your team members:
- General Managers: Responsible for reviewing daily labor percentages and daily sales trends to make immediate scheduling adjustments.
- Operations Leaders: Tasked with monitoring actual versus theoretical food cost variance across multiple units to identify training gaps or operational inefficiencies.
- Finance Managers: Responsible for analyzing the weekly cost of goods sold and prime cost trends to ensure overall brand profitability.
Clear ownership ensures accountability across both single and multi-unit operations, guaranteeing that the data is actively used rather than just collected.
Step 3: Conduct weekly operational reviews
The cornerstone of a profitable restaurant workflow is the weekly operational review. This is a recurring meeting where finance and operations teams come together to review the past week's performance.
The goal of this meeting is to investigate variances, identify margin erosion, and make immediate adjustments to labor scheduling or purchasing for the upcoming week. To do this effectively, teams need a collaborative analytics platform where they can drill down into the numbers. If you are just looking at static charts, you cannot ask follow-up questions or dig into the root cause of a sudden spike in overtime. You need a centralized accounting dashboard where both teams can interact with the live data.
How Quadratic streamlines restaurant data analytics
Customer analytics for restaurants often suffers from fragmentation across POS systems, accounting software, and inventory tools. This makes it difficult to build a consistent view of profitability, leading to delayed decisions and reactive management. Quadratic solves this by creating real-time restaurant analytics solutions where financial and operational data can be combined and analyzed together.
Direct connections to multiple operational and financial data sources
Quadratic integrates directly with inventory tools and accounting software such as QuickBooks. This allows restaurants to pull sales, cost, and expense data into one centralized workspace without manual data transformation.
With all data unified, teams can track revenue, cost of goods sold, and operating expenses together. This creates a complete, real-time view of restaurant performance across locations or time periods.
AI-powered data analysis for profitability insights
Quadratic leverages to analyze restaurant data and surface key insights, such as margin trends, cost anomalies, and labor inefficiencies. This allows teams to quickly identify where profitability is being impacted.
By automating business data analysis and complex calculations, AI agents for data analysis reduce the need for manual analysis. Restaurant operators can focus on decision-making rather than data preparation. Let’s see how this works.
First, I import my data into Quadratic:
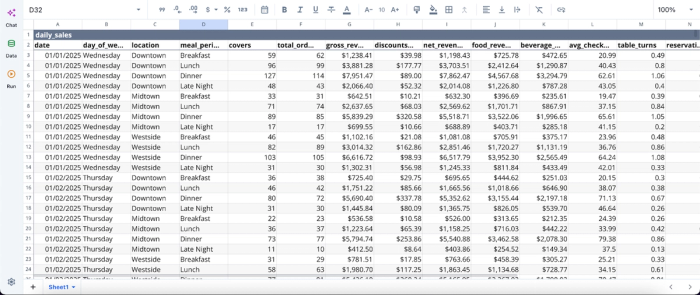
After successfully importing my data, I can dive straight into analysis. This sample data contains over 5000-rows of restaurant sales data. Quadratic also allows users to connect directly to their QuickBooks and financial data, enabling seamless data analysis. Here’s how we analyze data in Quadratic using text prompts:
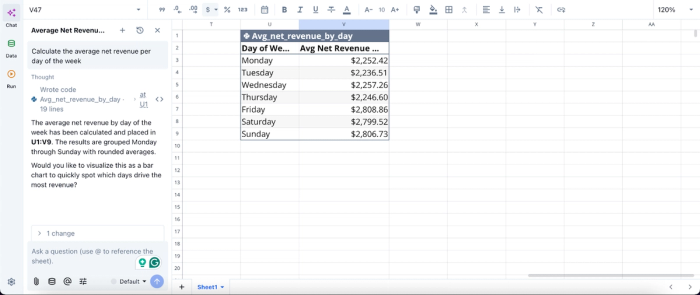
In this example, I ask Quadratic AI to “calculate the average net revenue per day of the week,” and it immediately produces a clear table breaking down average revenue by each day. The results highlight that Friday drives the highest revenue, with Sunday following closely behind.
AI data visualization
Quadratic enables the creation of dynamic sales data visualizations that show key metrics like daily sales, food costs, and labor ratios. These dashboards update automatically as new data is ingested.
Clear visualizations make it easier for managers to understand performance at a glance. This supports faster decision-making during weekly reviews or day-to-day operations. Here’s how to create interactive visualizations by using text prompts:
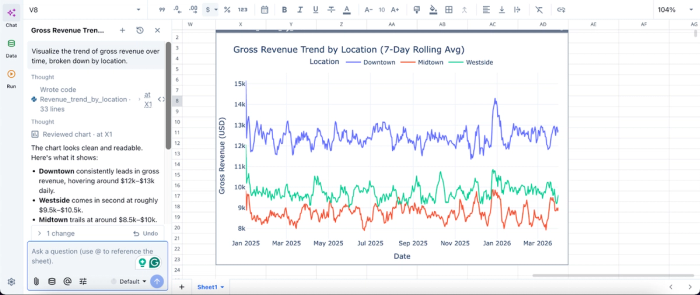
In this example, I simply ask Quadratic AI to “Visualize the trend of gross revenue over time, broken down by location,” and within seconds, it generates a time series chart segmented by each location. The visualization makes it immediately clear that Downtown consistently leads in revenue, followed by Westside and then Midtown.
Automated reporting and scheduled workflows
Quadratic enables automated data refresh and report generation, ensuring that restaurant analytics and reporting are always up to date without manual effort. Weekly or daily reports can run in the background.
This automation reduces operational overhead and ensures consistency in reporting. Teams can rely on a steady flow of accurate data for regular performance reviews.
Collaboration
Quadratic’s real-time collaboration features allow finance teams and restaurant operators to work together on the same datasets. This ensures alignment when investigating discrepancies or reviewing performance.
By sharing a single source of truth, teams can resolve issues faster and make more informed decisions. Collaboration also improves accountability across departments.
Conclusion
Profitable restaurant management requires moving beyond fragmented data and static dashboards. By establishing restaurant analytics solutions, you empower your team to actively monitor margin drivers and make timely adjustments.
Controlling costs and standardizing your performance tracking with the best data analytics tools for restaurants is a reliable way to scale a restaurant business successfully. When your operations and finance teams have a unified view of the data, they can protect your margins and drive sustainable growth. Try Quadratic for free and build a weekly restaurant performance dashboard.
Frequently asked questions (FAQs)
Why are data analytics tools important for restaurants?
The restaurant industry operates on thin margins, making effective data analytics crucial for survival and growth. The best data analytics tools for restaurants transform raw data into actionable insights, helping operators continuously monitor core margin drivers and prevent profitability leaks. This allows for timely adjustments to operations and finances.
How does fragmented restaurant data impact profitability?
Fragmented restaurant data, residing in isolated systems like POS and accounting software, prevents a clear view of profitability. This leads to delayed reporting, making it difficult for managers to make timely adjustments to purchasing or scheduling. A unified data source is critical for connecting operational and financial insights and preventing margin erosion.
How does Quadratic support effective data analytics in restaurants?
Quadratic centralizes restaurant data analytics by connecting financial systems like QuickBooks with operational data in a flexible spreadsheet environment. This allows finance and operations teams to collaborate in real-time to investigate discrepancies and generate consistent reports. Automated scheduling and AI features ensure that your data and analyses stay up to date, making it one of the best data analytics tools for restaurants focused on active workflows.