
James Amoo, Community Partner
May 19, 2026

Analysts and product teams face a constant challenge when dealing with financial news: the sheer volume of unstructured and stale data. Every day brings thousands of headlines, press, and macroeconomic updates. Simply pulling this data into a database is only half the battle. The real value lies in transforming raw headlines into actionable market intelligence.
Traditionally, developers have used a stock news API primarily to feed backend algorithms or quantitative trading models. However, there is immense value in using these same data feeds to power interactive financial data visualization. By shifting the focus from silent backend pipelines to user-facing workflows, analysts can gain visual insights into how global events impact specific assets.
The goal is to move beyond isolated text feeds. When you successfully pair a stock market news API with traditional market data, you create a dynamic environment for real-time monitoring.
What makes the best stock news API for dashboards?
Selecting the best stock news API for your specific use case requires evaluating several essential criteria to ensure your dashboard remains both responsive and relevant. The ideal API must strike a balance between high-speed data exploration and advanced stock market analysis. Let’s explore this using key criteria.
Real-time monitoring vs. historical data analysis
Building a comprehensive dashboard requires handling two distinct types of data: streaming breaking news and past events. Real-time monitoring demands low-latency connections, often using WebSockets or high-frequency polling, to push breaking updates to the user interface instantly.
Conversely, a historical stock news API is crucial for deeper analytical work. Analysts need to download historical stock data to backtest theories and identify recurring media patterns around earnings seasons. A well-designed dashboard should allow users to seamlessly toggle between a live monitoring mode for daily operations and a historical review mode for a deep-dive market context.
Advanced filtering and metadata tagging
To keep user-facing dashboards clean and relevant, filtering out noise is an absolute necessity. Raw news feeds contain everything from minor executive appointments to major macroeconomic shifts. If every update hits the main dashboard, critical signals will be lost in the noise.
Metadata tags are the solution to this problem. They allow developers to map specific news items directly to the relevant portfolio tickers or watchlists. The most effective APIs pre-categorize news by event type, making it easy to filter feeds specifically for earnings reports or investment portfolios. This ensures that users only see the headlines that actually matter to their specific investment thesis.
Data reliability and source credibility
Beyond speed and filtering, the reliability of the underlying data is a critical factor in selecting a stock news API. Not all news sources carry the same level of credibility, and poorly vetted information can lead to misleading conclusions or flawed trading decisions. A robust API should aggregate content from reputable publishers and clearly indicate the origin of each article.
Additionally, consistent data formatting and uptime guarantees are essential for maintaining a dependable dashboard. APIs that provide structured outputs with minimal downtime allow teams to build stable workflows without constantly handling edge cases or broken responses. This ensures that your dashboard remains a trusted source of insight rather than another point of operational risk.
Dashboard design principles for financial news
When building a market monitoring tool, it is important to shift the focus from data processing to user experience and visual layout. A successful dashboard must actively prevent information overload by establishing a clear visual hierarchy.
When configuring your news API for stock market applications, consider how the data feeds into the user interface. Grouping headlines logically makes the data much easier to digest. You can organize news feeds by sector, tag them by potential market impact, or group them by sentiment. A well-structured layout guides the analyst's eye to the most critical information first, ensuring that urgent events stand out from routine updates.
Contextualizing headlines with market indicators
A headline in isolation rarely tells the whole story. The most powerful dashboards display news feeds side-by-side with traditional market and fundamental data. This provides immediate visual context for how the market is reacting to the information.
Overlaying news volume or specific headline markers directly onto a price chart is a highly effective strategy. When an analyst sees a sharp price drop, a concurrent spike in news volume on the same chart instantly explains the movement. Additionally, showing financial statements alongside breaking news helps users quickly assess a company's resilience to sudden market shocks.
Integrating AI and sentiment analysis
Interpreting the tone of market-moving events is increasingly handled by artificial intelligence and sentiment analysis software. Incorporating sentiment scores into your dashboard UI transforms qualitative text into quantitative data that can be tracked and charted over time.
Many modern APIs provide pre-calculated sentiment scores, or you can generate them using a secondary AI finance tool. By translating these scores into color-coded indicators (such as green for positive, red for negative) or trend lines, you can visualize shifting news sentiment at a glance. This allows analysts to spot deteriorating market sentiment around a specific ticker before it fully materializes in the price action.
Real-time alerts and workflow integration
A high-performing financial news dashboard should not rely solely on passive monitoring. Instead, it should actively notify users when critical events occur. Setting up real-time alerts based on predefined conditions ensures that analysts can react immediately without constantly watching the screen.
Notifications should connect seamlessly with communication tools or trading systems so that insights can be acted upon quickly. By embedding alerts into the decision-making process, dashboards evolve from simple data visualization tools into proactive systems that drive timely and informed financial reporting.
Building a stock news dashboard in Quadratic
Quadratic provides an ideal environment for bridging the gap between technical financial API integration and visual dashboard design. By combining the familiarity of a stock tracking spreadsheet with built-in access for stock market data, analysts can pull live stock news without complex configurations. Let’s explore the features of Quadratic in detail.
Stream live news feeds into an analysis-ready grid
A dynamic stock news dashboard begins with reliable data ingestion. Quadratic allows you to connect directly to multiple news APIs and pull real-time headlines into the spreadsheet via its built-in stock market data connection. Instead of managing separate scripts, backend services, or yfinance alternatives, you can authenticate, fetch, and parse JSON responses directly within the grid.
Once the data is ingested, it can be immediately transformed into a structured dataset with consistent fields such as ticker, sentiment, timestamp, and source. This eliminates the friction of raw API outputs and creates a clean foundation for building dashboards that update continuously as new information arrives.
Combine news, price action, and fundamentals in one unified model
The real value of a stock news dashboard comes from context. Quadratic enables you to merge structured news data with built-in stock market data, including price movements, trading volume, and company fundamentals. By aligning headlines with ticker-level datasets, you can analyze how specific news events correlate with market behavior.
This model allows you to move beyond passive monitoring, acting as a hybrid stock scanner vs screener. You can track how earnings announcements affect volatility, observe how sentiment shifts influence short-term price trends, and build a more complete picture of market dynamics without switching between tools.
Build event-driven indicators with Python inside the grid
To turn news into a decision-making tool, you need to formalize its impact. Quadratic allows you to use native Python and SQL to create custom indicators based on news flow. You can measure sentiment trends or build signals for an AI stock picker that trigger when certain types of events occur.
The logic runs directly alongside your data, so you can iterate quickly and refine your models in real time. This approach transforms your dashboard from a passive display into an active research system that continuously evaluates market signals.
Navigate stock market news with AI-driven analysis
High-frequency news feeds can quickly become overwhelming. Quadratic’s AI capabilities help you convert raw text into actionable signals by summarizing articles, tagging them by event type, and identifying relevance to your watchlist. You can automatically categorize headlines into themes such as earnings or company-specific developments, much like a stock screener API.
This layer enables you to filter noise and focus on high-impact events. Instead of manually scanning headlines, your dashboard surfaces the most relevant insights, allowing you to respond quickly to meaningful changes in the market. Let’s see how this works in Quadratic:
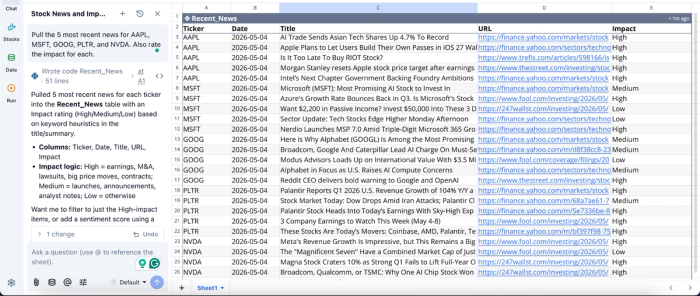
In this image, I simply prompt Quadratic AI to “Pull the 5 most recent news for AAPL, MSFT, GOOG, PLTR, and NVDA. Also rate the impact for each.” It instantly generates a table that shows recent news items from the listed companies. It also includes a URL for further reading and the impact of each news item.
Design interactive dashboards that update automatically
Quadratic makes it easy to build visual dashboards that connect directly to your structured datasets. You can create timelines that overlay news events with price charts or monitor spikes in news volume for specific stocks.
These visualizations are fully dynamic. As new data is ingested and processed, your charts update automatically, ensuring that your dashboard always reflects the latest market conditions.
Visualizations in Quadratic can also be done using text prompts:
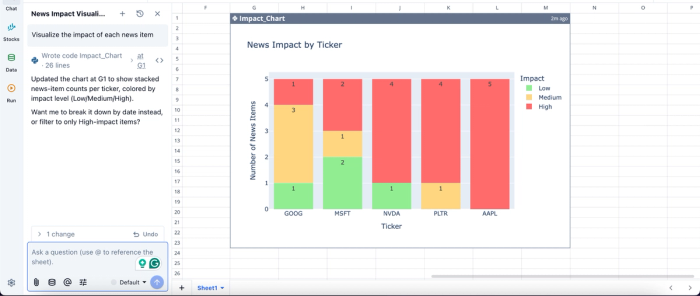
In this image, I ask Quadratic to “Visualize the impact of each news item.” In seconds, it creates a chart that visualizes the news impact by ticker, showing the extent to which these tickers have been affected by the news.
Collaborate on research and dashboard logic in real time
Stock analysis often involves multiple stakeholders, from analysts to portfolio managers. Quadratic’s collaborative analytics platform allows teams to work together on the same dashboard, reviewing data sources, refining classification logic, and validating insights collaboratively.
This eliminates version control issues and ensures that everyone operates from the same dataset and assumptions. It also makes it easier to audit decisions, as all transformations and logic remain visible within the grid.
Automate your dashboard pipeline from ingestion to insight
Manual updates are one of the biggest bottlenecks in maintaining a news dashboard. Quadratic supports scheduled execution of data retrieval and processing workflows, allowing your system to automatically fetch new headlines, classify them, and update visualizations in the background.
This spreadsheet automation ensures that your dashboard remains continuously up to date without requiring intervention. It transforms your workflow into a persistent monitoring system that delivers insights as events unfold.
Next steps: Start building your market monitoring tool
An effective stock news API should do more than power silent backend systems; it should be the engine behind contextualized dashboards that empower users to make informed decisions. By moving beyond isolated text feeds and combining alternative news data with traditional market metrics, analysts can uncover insights that would otherwise remain hidden in the noise.
The best way to understand the value of contextualized market intelligence is to create it yourself. Quadratic allows you to build a stock news monitoring dashboard that combines headlines, tickers, market data, and AI-assisted summaries. Try Quadratic for free.
Frequently asked questions (FAQs)
What features should you look for in the best stock news API?
The best stock news API for dashboards offers low latency for real-time updates, clear stock news API pricing, and rich metadata for advanced filtering. It should also provide robust historical stock news API access for deeper analysis and backtesting.
How does Quadratic help in creating dynamic stock news dashboards?
Quadratic provides a unified environment where you can pull real-time free stock news API data directly into a spreadsheet using Python. It allows you to seamlessly structure news alongside live prices and fundamentals, and use AI to classify headlines or visualize news volume against price movements.
Why is advanced filtering essential for a news API for stock market applications?
Advanced filtering is essential for a news API for stock market applications to prevent information overload and maintain relevance. By utilizing metadata tags, you can filter news by specific tickers, sectors, or event types, ensuring that only critical signals appear on your dashboard.