
James Amoo, Community Partner
Jun 1, 2026

Table of contents
- Why spreadsheet users are reaching for pandas
- What Pandas gives you that Google Sheets doesn't
- Mapping Google Sheets operations to pandas equivalents
- The hidden cost: collaboration friction in notebook workflows
- Quadratic spreadsheet: pandas inside the grid
- Wrapping up: dataframe power without leaving the grid
- Frequently asked questions (FAQs)
Exploring Google Sheets Pandas means you're probably standing at the edge of what traditional spreadsheets like Excel and Google Sheets can comfortably do. Maybe a VLOOKUP chain has grown unwieldy, or a dataset has gotten big enough that the grid stutters when you sort. Pandas, the Python data analysis library, promises a way out. This includes programmatic transformations, fast joins, and flexible aggregation. The downside is that most pandas workflows pull you out of the spreadsheet your team already collaborates in.
This guide walks through the practical paths between Google Sheets and pandas, including how to translate common spreadsheet operations into dataframe code, how to read from and write to Sheets, and where the standard notebook-based workflow starts to hurt teams. Then it looks at a third option that doesn't get enough attention: running the Pandas to Google Sheets workflow inside a native coding spreadsheet.
Why spreadsheet users are reaching for pandas
Spreadsheets are excellent at a lot of things, but every analyst eventually hits a ceiling. Formulas that worked at 1,000 rows start crawling at 100,000. A VLOOKUP that joined two tables cleanly becomes a chain of nested INDEX/MATCH statements that nobody can audit. A pivot table almost gives you the breakdown you want, but not quite, and there's no way to extend it with custom logic.
Pandas handles large datasets and makes multi-step data transformations repeatable rather than fragile. The Pandas read from Google Sheets integration is appealing because it lets you keep using the spreadsheet as a shared workspace while delegating the heavy lifting to Python.
The thesis of this article is simple. You don't have to leave the grid to get dataframe power. You can keep your collaborative spreadsheet and still run pandas against it, and in some setups, you can run pandas directly inside it. We’ll see how this works in a bit.
What Pandas gives you that Google Sheets doesn't
Before mapping operations, it is worth being precise about what pandas actually adds to a spreadsheet workflow. A pandas script executes the same way every time, making spreadsheet automation far more reliable than formula chains that gradually drift as cells are edited and pasted. Pandas also handles larger datasets far more comfortably than Google Sheets.
While Sheets begins to slow down as row counts and formula complexity increase, pandas routinely works with datasets containing millions of rows. Operations such as joins, aggregations, and reshaping become significantly cleaner as well. A single df.merge() or df.groupby().agg() can replace a complex web of lookup formulas and pivot tables. Just as importantly, the logic lives in code that can be reviewed, making it easier to understand what changed and why over time.
The tradeoff, of course, is that you give up the visual and collaborative grid that makes spreadsheets so approachable in the first place. That is the tension many analysts run into. Pandas provides the scale, reproducibility, and expressiveness they want, while spreadsheets provide the visibility and collaboration they need.
This is where Quadratic helps bridge the gap. Quadratic combines a spreadsheet interface with native Python support, allowing users to work with pandas directly inside the grid rather than moving analysis into separate notebooks and scripts. Data, code, charts, and outputs remain visible in the same workspace, preserving the collaborative spreadsheet experience while giving users access to the full power of pandas for large-scale research and data analysis.
Mapping Google Sheets operations to pandas equivalents
The fastest way to get comfortable with Python pandas Google Sheets workflows is to translate the operations you already know. Here's how the most common spreadsheet tasks map into dataframe code.
Filtering and sorting
In Sheets, you create a filter view and pick conditions, then sort by a column. In pandas:
- Filtering: df[df['revenue'] > 10000] returns only rows where revenue exceeds 10,000. You can chain conditions with & and |, for example df[(df['region'] == 'EU') & (df['revenue'] > 10000)].
- Sorting: df.sort_values('revenue', ascending=False) mirrors a descending sort on a column, and you can pass a list of columns for multi-key sorts.
Filters in pandas are expressions, not toggles, which means you can compose them, save them, and reuse them across analyses.
VLOOKUP and XLOOKUP with merge
VLOOKUP works fine for single-key lookups. It falls apart on multi-key joins or anything that needs left/right/inner/outer semantics.
The pandas equivalent is df.merge():
- df.merge(other, on='customer_id', how='left') for a left join.
- df.merge(other, on=['customer_id', 'order_date'], how='inner') for a multi-key inner join.
Merge scales cleanly because it operates on whole tables rather than evaluating one formula per cell. For analysts who have built three-deep VLOOKUP chains, switching to merge is usually the single biggest quality-of-life upgrade.
Pivot tables with pivot_table and groupby
Pivot tables in Sheets are convenient but rigid. Pandas gives you two complementary tools:
- df.pivot_table(index='region', columns='product', values='revenue', aggfunc='sum') produces a familiar pivot output.
- df.groupby(['region', 'product']).agg({'revenue': 'sum', 'orders': 'count'}) is more flexible. You can apply different aggregations to different columns, including custom functions, in a single pass.
If you've ever wanted a pivot that uses median for one column and sum for another, groupby is the answer.
Conditional logic and calculated columns
Nested IF formulas are a classic source of spreadsheet fragility. Pandas alternatives:
- np.where(df['score'] > 80, 'pass', 'fail') for a simple binary condition.
- df['tier'] = df['revenue'].apply(lambda x: 'high' if x > 100000 else 'low') for row-level logic.
- df.assign(margin=lambda d: d['revenue'] - d['cost']) for clean, chainable column creation.
The result is logic you can read, test, and reuse, instead of a formula bar that scrolls off the screen.
Cleaning and deduplication
Most analyses spend more time on data cleaning than on the actual question. Pandas has compact tools for the common steps:
- The drop_duplicates() API reference explains all available parameters. For example, df.drop_duplicates(subset=['email']) removes duplicate rows by key.
- df.fillna(0) or df.fillna(method='ffill') to handle missing values.
- df.astype({'amount': 'float', 'date': 'datetime64[ns]'}) to enforce types.
Compared to a series of helper columns and find-and-replace passes, this is faster and easier to redo when the source data refreshes.
The hidden cost: collaboration friction in notebook workflows
Most Pandas write to Google Sheet tutorials end at the read/write loop. They don't address what that loop actually feels like on a team.
When Pandas lives in a Jupyter notebook, and the data lives in Google Sheets, every analysis becomes a miniature import-export project. Someone exports a snapshot or pulls the data through an API, runs the analysis in a notebook, and pushes the results back into a tab or report. The process works, but it creates a separation between where the data lives and where the logic lives.
A few problems compound from there. Version control gets murky: which CSV is current, which notebook produced which tab, and which version of the analysis matches the numbers in the latest deck. Non-technical teammates can't open the notebook to audit a calculation or tweak a parameter, so requests pile up on whoever owns the Python. Charts and outputs end up in two places, and they drift apart as the underlying data changes.
None of this is a flaw in pandas. It's a flaw in the seam between pandas and the collaborative grid. The notebook was designed for solo analysis. Spreadsheet teams need something else.
Quadratic spreadsheet: pandas inside the grid
Quadratic is built around exactly that workflow. You can write pandas directly in a spreadsheet cell, and the dataframe renders into the grid as a normal table. df.groupby(), df.merge(), and df.pivot_table() all run inside the spreadsheet, with results sitting next to formulas and other cells. Let’s explore the features of Quadratic in detail.
Connect live data sources instead of importing CSVs repeatedly
One of the biggest pain points in spreadsheet-plus-pandas workflows is the constant export cycle. Data comes from a warehouse or API, gets exported into CSVs, cleaned in Python, and then uploaded into a spreadsheet for sharing. Every step creates another stale copy.
Quadratic removes much of that friction through direct connections to databases and APIs. You can connect to Postgres, Snowflake, Supabase, MySQL, or external APIs directly from the spreadsheet, then query or transform the live data with pandas inside the same file.
That creates a much tighter operational workflow. A marketing team can pull campaign performance data directly from an API, clean attribution fields with pandas, aggregate conversion metrics, and visualize the result in the same sheet. A finance analyst can query transaction data from a warehouse, reconcile categories with Python, and publish updated accounting dashboards without exporting anything manually.
Write pandas directly in the spreadsheet grid
Quadratic is built for the exact workflow people are usually trying to create when they combine Google Sheets with pandas. Instead of maintaining a separate notebook and then exporting results back into a spreadsheet, you write pandas code directly inside spreadsheet cells and see the resulting dataframe render into the grid immediately.
That changes the workflow structurally. A df.groupby() result is not trapped inside a notebook output pane. It becomes a live table in the sheet that teammates can sort or extend with formulas. A df.merge() operation behaves like a spreadsheet-native join rather than an external preprocessing step. The transformation logic and the resulting data stay together in the same workspace.
For analysts handling recurring reporting cycles, this means the spreadsheet becomes the actual analysis environment rather than the presentation layer sitting at the end of a Python pipeline.
Combine pandas with formulas, SQL, and spreadsheet logic
Quadratic is not limited to pandas alone. Python, SQL, and spreadsheet formulas all coexist in the same environment, which is important for teams that operate across different levels of technical complexity.
A workflow might begin with SQL data analytics pulling transactional data from a warehouse, continue with pandas for cleanup and reshaping, and finish with spreadsheet formulas for scenario modeling or business-specific calculations.
That combination maps closely to how real teams work. Technical analysts can write dataframe transformations, while spreadsheet-native users continue working with formulas and charts in the same file. Nobody has to leave the environment they are comfortable with.
Use AI to generate and explain pandas transformations
Quadratic also reduces the barrier for teams that want dataframe-level power without requiring every analyst to be deeply fluent in pandas syntax.
Instead of writing every transformation from scratch, users can describe the task in natural language and let the AI generate the pandas logic directly in the sheet. Prompts like “group revenue by month and region,” “remove duplicate customer IDs,” or “calculate rolling 30-day averages” generate editable Python cells tied to the actual data already loaded into the workbook.
The important distinction is where the output lands. The AI does not return a disconnected chat response. It writes executable logic directly into the spreadsheet environment where the data already lives. Analysts can inspect the generated code and build downstream calculations on top of it.
Let’s see how we can use AI-generated Pandas code to clean a dirty dataset in Quadratic:
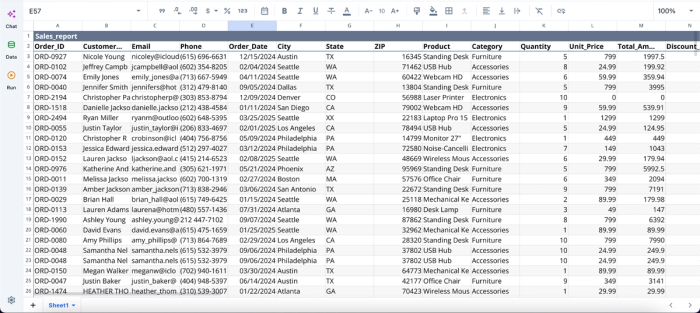
After importing our dataset into Quadratic, we can immediately begin analysis using AI:
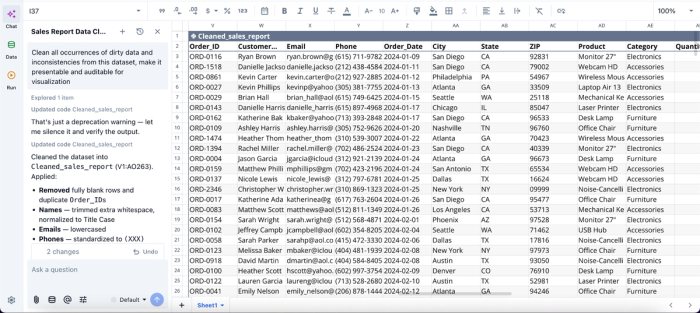
In this image, I ask Quadratic AI to “Clean all occurrences of dirty data and inconsistencies from this dataset, make it presentable and auditable for visualization.” It instantly creates a new table with corrections to inconsistencies like the duplicates, missing values, and inconsistent formatting.
It also provides the Pandas and Python logic for maximum transparency and auditability. Here:
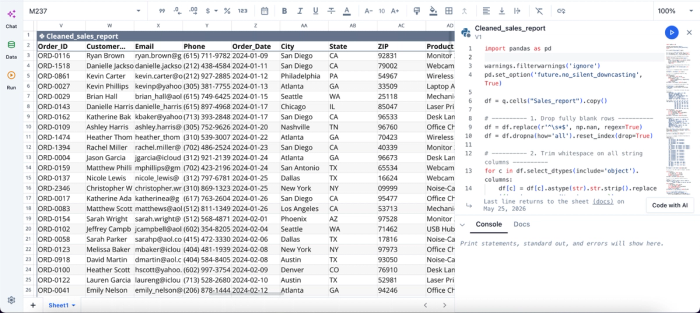
The image above shows the code equivalent of the analysis we conducted, which can be obtained by clicking into a cell from the table. Users can see the logic behind their insights and modify them if needed.
Build charts from dataframe outputs without leaving the file
Traditional pandas workflows often split analysis and visualization across separate BI tools. The dataframe lives in Python, while charts get rebuilt in another dashboarding platform or copied into slides manually.
Quadratic keeps visualization inside the spreadsheet itself. A dataframe generated from pandas can immediately feed charts, pivot-style summaries, KPI blocks, or dashboards in adjacent cells.
A sales operations team, for example, can connect CRM data, aggregate pipeline metrics with pandas, and generate live funnel charts directly in the same workbook. An operations team can clean logistics data and produce delivery-time histograms without exporting results to another data visualization tool.
Here’s an example of how to generate interactive visualizations in Quadratic:
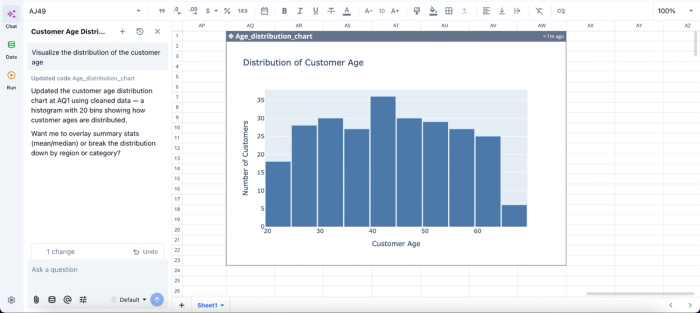
In this image, I ask Quadratic AI to “Visualize the distribution of the customer age.” In seconds, it creates a chart that shows the distribution of customer age across the dataset.
Keep collaboration inside the analysis environment
One of the hidden problems with notebook-based pandas workflows is collaboration. Sharing often means screenshots, exported CSVs, or asking teammates to recreate a local Python environment.
Quadratic keeps the collaboration model spreadsheet-native. Multiple users can work in the same browser-based sheet simultaneously while seeing the same live data and pandas outputs.
A teammate who does not write Python can still inspect the resulting tables or validate assumptions directly in the workbook. The pandas code remains visible for auditing and review instead of being hidden inside a separate repository or local script.
Wrapping up: dataframe power without leaving the grid
The reason Google Sheets pandas is such a common topic isn't that spreadsheet users want to learn Python for data analysis from scratch. It's that they want pandas-level control over their data without giving up the collaborative grid their team already lives in. The traditional answer solves the analysis problem but breaks the collaboration problem.
The better answer is to bring pandas into the spreadsheet itself, where transformations, charts, and shared editing all live in one place. Quadratic offers this capability by allowing you to use Pandas directly inside the grid for spreadsheet-native data cleaning, transformation, and analysis.
Frequently asked questions (FAQs)
Why does the notebook-based workflow cause collaboration problems?
When Pandas lives in a Jupyter notebook, and data lives in Sheets, analysis becomes a series of manual import-export steps. Teammates can't easily audit the code, and non-technical team members can't tweak parameters or run follow-up analyses without waiting for the notebook owner. The seam between the notebook and the spreadsheet creates friction that compounds as analysis becomes more shared and iterative.
How does Quadratic solve the pandas and Google Sheets workflow problem?
Quadratic brings pandas directly into the spreadsheet, eliminating the import-export loop entirely. You write pandas code like df.groupby() or df.merge() directly in a cell, and the results render as a normal table in the grid. Raw data, transformation logic, and outputs all live in one workspace, so there's no separate notebook to keep in sync or CSV passing through email.
When should I use gspread versus a spreadsheet-native Python tool?
Use gspread and the export-import loop when your team is fully spreadsheet-bound, and pandas analysis is occasional, such as one-off reports. Use a spreadsheet-native Python tool like Quadratic when analysis needs to be both pandas-powered and collaboratively editable, especially if non-technical teammates need to audit or extend the work. The right choice usually depends on who needs to read and edit the result, not just who wrote the code.