James Amoo, Community Partner
Jun 1, 2026

If your team works with SQL Server data inside spreadsheets, you have probably noticed a pattern. The same query, run on the same schedule, exported to the same CSV, and pasted into the same tab. The Google Sheets SQL Server workflow is everywhere, and it is almost always built on manual exports.
This post diagnoses why that loop persists, where it breaks down, and what a better model looks like when freshness and repeatability actually matter.
Why teams want SQL Server data in Google Sheets
Analysts, ops leads, and finance teams live in spreadsheets. It is where they model, reconcile, slice, and share. But for many organizations, SQL Server is the system of record. Customer data, transactions, inventory, and operational metrics all sit in tables that the spreadsheet user cannot touch directly.
Google Sheets becomes the default destination for a few obvious reasons. It is familiar. It supports formulas and lightweight data exploration without setup. It is easy to share with stakeholders who would never open SSMS. And it lets non-technical teammates and citizen developers collaborate on the same numbers without requesting database access.
That sets up the core tension behind every SQL Server Google Sheets integration. SQL Server is the source of truth, Sheets is the data processing surface, and the gap between them is exactly where things go wrong. The bridge teams build to close that gap, usually a CSV export, is the source of most of the pain.
Quadratic offers a more integrated approach. Quadratic combines a spreadsheet interface with native Python and SQL support, allowing users to query databases directly from the same environment where they analyze and visualize the results. Instead of treating the spreadsheet as a disconnected destination for exported data, it becomes a live workspace connected to the underlying source of truth.
The manual export loop and why it persists
The typical workflow is so common that it is almost invisible. An analyst opens SSMS or another SQL client, runs a query, exports the results to CSV, and either uploads the file to Drive or pastes the rows into a Sheets tab. Then they rebuild the formulas and refresh the chart references. Next week, they do it all over again.
This loop persists because it is the path of least resistance. It does not require an IT ticket, a connector license, or a security review. It works on day one with credentials the analyst already has. For a one-off question, it is genuinely the right answer.
The problem is that almost no question stays one-off. The export loop scales poorly and fails in predictable ways. Stale data appears the moment it is exported and pasted, meaning every analysis downstream is working from a snapshot rather than the current state of the database. Version chaos follows naturally and slightly different filters, creating confusion about which numbers are actually correct.
Manual refreshes become a recurring operational burden, forcing someone to repeat the same export-and-paste process every week or month instead of benefiting from true spreadsheet automation. As datasets grow, additional issues emerge: large query results may be truncated, values can be silently converted into incorrect data types, and spreadsheet row limits start imposing constraints that did not exist in the underlying database. Once you start trying to import SQL Server to Google Sheets at any meaningful cadence, these failure modes compound.
Options to connect Google Sheets to SQL Server
There is no first-party Google connector for SQL Server, so every option to connect Google Sheets to SQL Server is either a workaround or a third-party product. Here is a high-level look at the main approaches and where each one tends to break.
JDBC and Apps Script
Apps Script includes a JDBC service that can query SQL Server directly. With some code, you can pull rows into a sheet and even schedule the script to run on a timer.
Strengths: It is free, fully customizable, and lives inside the Google ecosystem.
Limitations: It requires code maintenance and someone willing to own it. You typically need IP allowlisting on the SQL Server side, Apps Script has runtime limits that fail on larger result sets, and any schema change can quietly break the script. It is fragile in exactly the way analyst-driven workflows cannot afford.
Third-party connector add-ons
The Google Workspace Marketplace has several add-ons that broker a Google Sheets SQL Server connection. They handle authentication, expose a query builder or SQL editor, and offer scheduled refresh.
Strengths: faster setup than scripting, no-code or low-code interfaces, and built-in scheduled refresh.
Limitations: per-seat pricing adds up across a team, vendor lock-in is real, refresh latency is bound to the connector's schedule, and most products impose row caps. Security review for a third-party tool that touches the production database is rarely fast.
ETL and sync platforms
Larger pipelines can sync SQL Server to Google Sheets on a schedule, often as part of a broader data movement strategy.
Strengths: handles volume well, automates refresh, and centralizes credentials.
Limitations: still batch-based, so it is not truly live. It is also overkill for analyst-driven, exploratory work, and it usually requires data engineering involvement to set up and maintain.
Across all three approaches to Google Sheets SQL Server integration, you are choosing between fragility, latency, and overhead. None of them gives you a spreadsheet that simply speaks SQL Server.
Quadratic: a spreadsheet with a native SQL Server connection
Quadratic is a spreadsheet with a direct SQL Server connection. There are no add-ons to install, no Apps Script to maintain, and no CSV export step. You write spreadsheet SQL queries directly in cells, and results populate the grid and update when you rerun the query. Let’s explore the features of Quadratic in detail.
Build reporting models on top of live SQL Server data
One of the biggest limitations of export-driven workflows is that every report starts aging the moment it is created. Teams often make decisions using snapshots generated hours, days, or even weeks earlier.
Quadratic allows reporting models to operate directly on current SQL Server data. Financial reports, operational dashboards, customer metrics, and forecasting models can all reference live query outputs inside the spreadsheet. When the query refreshes, the downstream calculations update alongside it.
This is particularly valuable for finance and operations teams managing recurring reporting cycles. Monthly close reports, sales pipeline reviews, inventory dashboards, and KPI tracking models can all draw from the same source of truth without requiring repeated exports and imports.
Use SQL, Python, and formulas in the same analytical workflow
Many database-driven reporting processes eventually outgrow SQL alone. Querying retrieves the data, but modeling, forecasting, statistical analysis, and business-specific calculations often require additional database analytics capabilities.
Quadratic brings SQL, Python, and spreadsheet formulas together inside the same workbook. SQL retrieves and aggregates information from SQL Server. Python handles data cleaning, forecasting, machine learning, and advanced data transformations. Spreadsheet formulas provide familiar business logic and reporting calculations.
A finance team might query transaction-level data from SQL Server, calculate scenario projections using Python, and build executive budgeting workflows with spreadsheet formulas. An operations team could retrieve supply chain metrics with SQL, perform anomaly detection in Python, and create performance scorecards using formulas.
Use AI to accelerate database analysis
Writing SQL is not always the hardest part of analysis. Understanding the data and generating useful business insights often consumes far more time.
Quadratic's built-in AI helps analysts move faster by generating SQL queries, Python transformations, summaries, and calculations directly within the spreadsheet. Instead of manually constructing every query, users can describe the outcome they need and receive executable logic tied to the connected SQL Server data.
An operations manager could ask the AI to identify regions with declining fulfillment performance. A finance analyst could request a breakdown of customer profitability trends over the last twelve months. The generated logic appears directly in the workbook, making it easy to inspect, modify, and extend.
Let’s see an example using a finance dataset. First, I connect to my bank account using Quadratic’s Plaid integration:
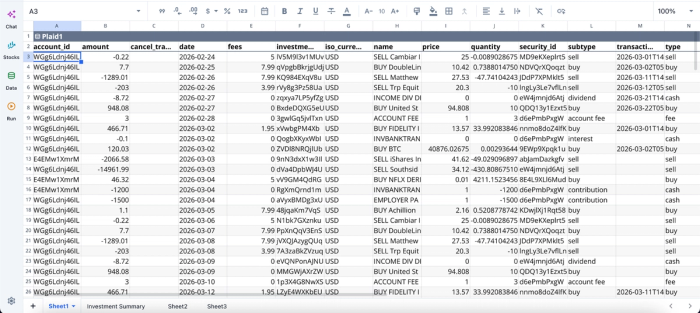
After successfully connecting to my data, I can immediately begin analysis:
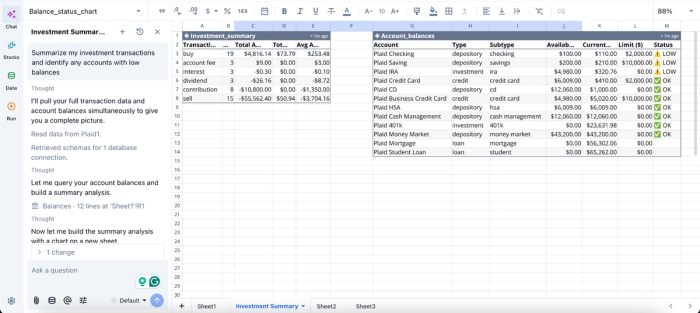
In this image, I ask Quadratic to “Summarize my investment transactions and identify any accounts with low balances.” It instantly creates two tables: one that shows a summary of my investment, and another that gives insights into my accounts with low balances.
Visualize live database metrics without exporting data
Database reporting frequently suffers from tool fragmentation. Data is queried in one application, transformed in another, and visualized somewhere else. Every handoff introduces complexity and increases the risk of inconsistent results.
Quadratic keeps visualization attached directly to the live SQL Server workflow. Query results can feed charts, dashboards, KPI scorecards, and summary reports inside the same spreadsheet where the data was retrieved.
A customer success team can create retention dashboards directly from SQL Server records. A finance department can build financial data visualizations tied to current transactional data. An operations team can track fulfillment trends using different charts that update as fresh records enter the database.
Visualization in Quadratic can also be done using text prompts. Here’s an example:
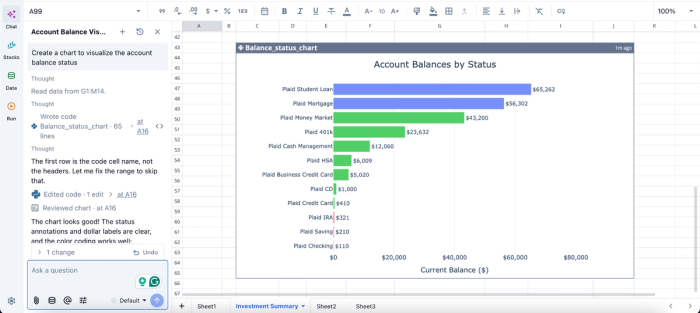
In this image, I ask Quadratic to “Create a chart to visualize the account balance status.” In seconds, it creates a chart that shows the account balance by status.
Collaborate around a shared source of truth
Traditional spreadsheet reporting often creates multiple versions of the same analysis. One person refreshes the export, and a third distributes a different version through email. Over time, confidence in the numbers begins to erode.
Quadratic addresses this challenge through real-time multiplayer collaboration. Teams work in the same spreadsheet, against the same SQL Server connection, using the same underlying data. Queries, formulas, Python cells, notes, and dashboards remain visible to everyone involved in the analysis.
That makes workflows easier to maintain and easier to inherit. New team members can see how the data was queried, how it was transformed, and how final metrics were calculated without reverse-engineering disconnected spreadsheets.
Conclusion
The real problem most analysts face is the manual export loop itself. As long as the spreadsheet does not speak Google Sheet SQL Server, every workflow built on top of it inherits staleness and repetitive refreshes. Swapping one connector for another only changes the shape of those failures.
A spreadsheet with a native SQL Server connection eliminates the loop. Queries run on demand, results are live, and the artifacts your team builds on top, formulas, pivots, charts, and shared analyses, always reflect the current state of the database.
Quadratic is built for exactly this. It allows you to connect to SQL Server directly and analyze live database data in a spreadsheet without fragile Google Sheets workflows. Try Quadratic for free.
Frequently asked questions (FAQs)
Is there a free way to import SQL Server to Google Sheets?
App Script with the JDBC service is the closest free path to a Google Sheets SQL Server connection. It works for small, stable workloads but requires code maintenance, IP allowlisting on the database, and ongoing upkeep. Runtime limits and fragility under schema changes make it a poor fit for production reporting.
What are the main limitations of Google Sheets connectors for SQL Server?
Third-party connectors impose row caps, tie refresh latency to their schedule, break when credentials rotate, or schemas change, charge per-seat pricing, and often require security review for production database access. Most importantly, they refresh on a schedule rather than on demand, so your spreadsheet always shows a snapshot, not the current state of your data.
How does Quadratic solve the Google Sheets to SQL Server problem?
Quadratic is a spreadsheet with a native SQL Server connection built in. You write SQL queries directly in cells, results populate the grid, and you can refresh on demand whenever you need current data. From there, you combine SQL output with Python and formulas in the same sheet for modeling and analysis, all without exporting CSVs or managing third-party connectors.