James Amoo, Community Partner
Apr 20, 2026

Agencies scale by adding new clients and expanding campaigns, but manual reporting processes often break under the weight of that growth. When account managers rely on manual data exploration and disconnected spreadsheets, pulling weekly or monthly metrics becomes a massive bottleneck. Time spent wrangling CSV exports directly cuts into the time available for analyzing performance and providing strategic advice.
This operational bottleneck introduces a severe business risk. To fix this issue, scaling agency operations requires tools built for repeatable reporting workflows. Finding the best client dashboard tools for agencies is about adopting systems that let your team consistently deliver clear and easily updateable insights across your entire client roster.
What makes a great client dashboard tool?
A truly effective agency reporting tool moves beyond surface-level vanity metrics. It must focus on actionable KPI tracking that ties directly to a client's specific business goals. To achieve this level of reporting, reliable data integration is non-negotiable. Your agency analytics dashboard needs to pull metrics automatically from various ad platforms like Google Analytics spreadsheets, databases, and CRMs.
Marketing data visualizations also need to adhere to principles of effective data visualization so clients can understand their performance at a glance. Furthermore, agencies need a delicate balance between standardization and customization. Standardized layouts drive internal efficiency, while flexible components allow you to cater to unique client objectives.
Another important factor is clarity in telling data stories. A great agency client dashboard should guide the client through what the data means and why it matters. This includes highlighting trends and providing context around performance shifts. When done well, the dashboard becomes a communication tool that supports better decision-making rather than just a collection of different chart types.
Finally, ease of maintenance and scalability play a critical role. As client accounts grow and campaigns become more complex, your reporting system should be able to handle additional data sources and metrics without requiring constant rework. A well-designed dashboard framework ensures updates are efficient and consistent, allowing agencies to scale their reporting processes without sacrificing quality or accuracy.
How to build scalable multi-client reporting workflows
Choosing the right software is only half the battle. A truly scalable reporting system relies on processes that reduce repetitive work while maintaining high-quality output. Optimizing your data analytics strategy is the key to scalable multi-client delivery and agency operations.
Standardize with reusable templates
The most effective way to scale is by creating a full-funnel marketing blueprint that covers roughly 80 percent of standard client needs. Standardizing the core layout ensures consistency across the agency. It also dramatically speeds up the onboarding process for new clients.
Within this blueprint, leave flexible modules for the remaining 20 percent of bespoke client requests. This guarantees that you are not reinventing the wheel every month, yet you still have the freedom to add custom metrics when a specific campaign demands it.
Automate data refreshes
To truly scale, agencies must move away from CSV exports and manual copy-pasting. Connecting directly to live data sources and implementing spreadsheet automation ensures that your reports are always up-to-date.
Automated data pipelines handle the heavy lifting of data collection, including real-time Google Analytics data. This frees up account managers and analysts to focus on crafting a compelling narrative and refining campaign strategy rather than performing tedious data transformation.
Customize insights and collaborate
Once a standardized template is in place, the next workflow step is layering on client-specific insights. Real-time multiplayer collaboration allows analysts and account managers to work in the same environment. They can review the data and finalize a report together before client delivery.
The best agency dashboards are never just charts and graphs. They include written context and explainable insights alongside the visuals. Collaborative tools make it easy to draft this narrative directly next to the live data.
Retaining clients with insight-driven dashboards
Efficient reporting workflows ultimately serve a much larger goal: client retention and agency growth. Delivering clear and timely dashboards builds immense trust. It is the most direct way to prove agency value and demonstrate ROI to stakeholders.
When agencies spend less time building marketing and financial reports, they can spend more time optimizing campaigns and driving the actual results that clients care about. Insight-driven dashboards transform the agency-client relationship from a transactional service into a strategic partnership.
Another key advantage is the ability to proactively communicate performance. Instead of waiting for clients to ask questions, agencies can use dashboards to surface insights early and highlight growth opportunities. This reinforces confidence and positions the agency as a forward-thinking partner rather than a reactive service provider.
Consistent reporting also strengthens long-term alignment. When clients clearly understand how their goals connect to measurable outcomes, it becomes easier to set expectations and plan future strategies. Over time, this reduces churn risk and creates a foundation for expanding the relationship through additional services or larger engagements.
Building a unified client dashboard with Quadratic
Agency reporting often breaks down under the weight of multiple clients and constantly changing requirements. Prebuilt agency dashboard tools lack flexibility, while traditional BI tools are too resource-intensive for fast-moving teams. Quadratic provides a live workspace where agencies can build fully automated client dashboards without sacrificing speed or control.
Direct connections to multiple client data sources
Quadratic enables agencies to connect directly to marketing platforms, CRM systems, and analytics tools. This allows data from all client touchpoints to flow into a single workspace without manual exports.
With centralized ingestion, agencies can unify campaign performance and customer engagement metrics. This ensures that every dashboard reflects a complete and accurate picture of client performance.
AI-powered data analysis for client insights
Quadratic integrates AI agents for data analysis to help agencies analyze campaign data, identify trends, and generate insights across multiple clients. This includes evaluating performance metrics and surfacing optimization opportunities.
AI-assisted workflows reduce the time spent on manual analysis, allowing teams to focus on insight generation. This is especially valuable when managing large client portfolios with diverse datasets. Let’s see how this works.
First, I import a sample client invoice data into Quadratic’s interface:
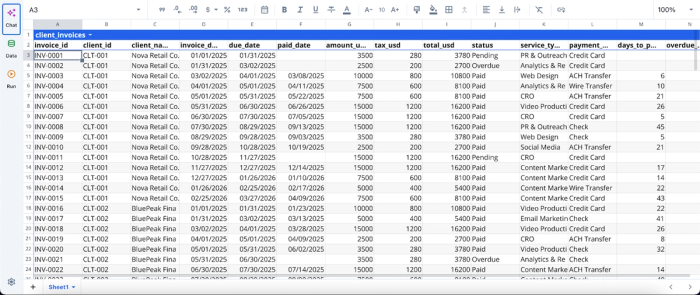
After successfully importing your data into Quadratic, you can immediately begin analysis using text prompts. No additional setup is required. Here:
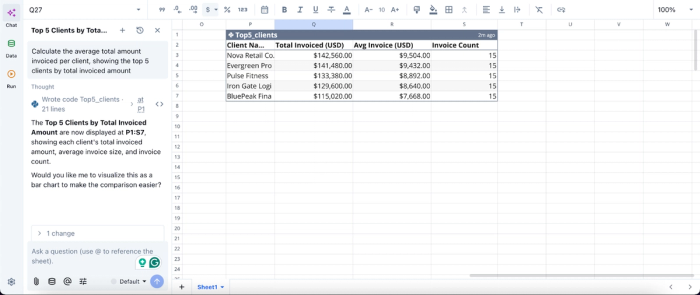
Here, I ask Quadratic AI to “Calculate the average total amount invoiced per client, showing the top 5 clients by total invoiced amount.” It instantly generates a table that shows the total invoiced amount, average invoice, and invoice count for each client. Users do not need expertise in coding or spreadsheet formulas to generate insights in Quadratic.
AI data visualization for client-ready reporting
Quadratic allows agencies to build presentation-ready visualizations that automatically update as data changes. Visualizations such as performance trends, channel breakdowns, and ROI metrics are generated directly from the underlying data.
These dashboards can be tailored to each client’s priorities, ensuring that reports are both relevant and easy to interpret. This improves communication and helps clients quickly understand key outcomes. Like data analysis, visualization in Quadratic can be done by using text prompts. Here’s an example:
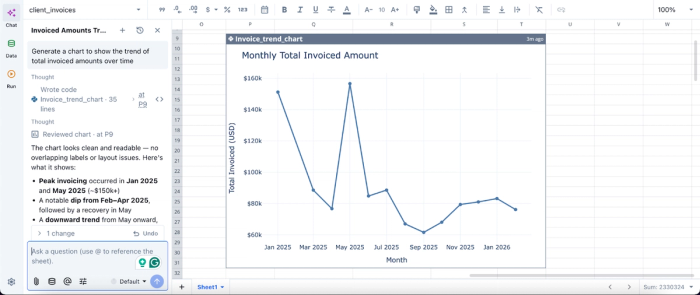
In this image, I ask Quadratic AI, “Generate a chart to show the trend of total invoiced amounts over time.” In seconds, it creates a time series chart that shows the monthly total invoiced amount across different periods. From this visualization, we can see that May 2025 had the highest invoiced amount throughout the year.
Native support for programming languages
With built-in Python, SQL data analytics, and spreadsheet formulas, Quadratic enables agencies to implement advanced reporting logic. This includes custom attribution models, multi-touch analysis, and performance forecasting.
This allows agencies to go beyond standard metrics and deliver deeper insights. All logic remains transparent and editable, making it easy to adapt as client needs evolve.
Reusable dashboard templates for scale
Quadratic enables agencies to create standardized marketing agency dashboard templates that can be reused across multiple clients. These templates can be customized with client-specific data sources and metrics.
This significantly reduces setup time while maintaining consistency in reporting quality. As new clients are onboarded, dashboards can be deployed without starting from scratch.
Real-time collaboration across agency teams
Quadratic supports real-time collaboration, allowing analysts, account managers, and leadership to work together on the same dashboards. This ensures alignment across teams.
Collaboration also speeds up iteration. Teams can quickly review and validate reports before sharing them with clients.
Conclusion
The best client dashboard tools for agencies are the ones that adapt to your unique workflow, rather than forcing your team into a rigid box. Moving past manual reporting and inflexible platforms is essential for long-term growth. By adopting an automated approach, your agency can deliver high-quality insights at scale.
Quadratic allows you to seamlessly build a reusable client dashboard that you can adapt per client and refresh automatically. Try Quadratic for free.
Frequently asked questions (FAQs)
How does Quadratic help agencies build scalable client dashboards?
Quadratic provides a flexible spreadsheet environment that supports live data connections, Python, SQL, and formulas, all in one browser-based canvas. Agencies can create reusable templates that automatically refresh, eliminating manual updates and enabling quick customization for individual clients.
What key features should agencies look for in the best client dashboard tools?
Effective client dashboard tools should offer reliable data integration from various platforms and support actionable KPIs tied to client goals. They also need to provide clear data visualizations and strike a balance between standardized reporting templates and the flexibility for custom client requests.
What are the benefits of implementing scalable multi-client reporting workflows?
Scalable reporting workflows reduce repetitive manual work, ensuring high-quality and timely reports. This frees up agency teams to focus on campaign optimization and strategic advice, ultimately building client trust and driving agency growth and retention.