
James Amoo, Community Partner
May 7, 2026

Tracking investments in a spreadsheet is a staple for financial data analysis, but basic setups often fall short. Grabbing a single current price is a great start. However, true robust investment portfolio management requires historical data and repeatable workflows.
Getting basic stock quotes in Excel is just the beginning. Setting up live stock quotes in Excel can kickstart your tracking, but robust analysis requires an evolving approach that incorporates deep historical stock data.
This guide covers native stock data retrieval methods, building a robust investment tracking template, and scaling up analysis with historical data and modern spreadsheet tools.
How to get stock quotes in Excel: native methods
Modern spreadsheets feature built-in tools that make manual data exploration obsolete. If you are wondering how to get stock data in Excel without typing them out daily, native functions are the answer. You can convert standard text into functional financial entities directly within your grid.
Using the stocks data type for current prices
The built-in stock data type is an easy way to get stock quotes in Excel quickly. To use it, type a ticker symbol into a cell and highlight it. Navigate to the data tab and select the stocks data type. The cell will convert into a rich financial entity.
From there, you can extract specific metrics into adjacent cells. You can pull the current price, 52-week high, and market cap with a simple click. This method provides free stock quotes in Excel that update automatically. It is best suited for top-level dashboard views rather than deep stock screening.
Fetching past performance with STOCKHISTORY
To move from basic snapshots to advanced stock market analysis, you need historical context. The STOCKHISTORY function is the critical bridge. This function pulls past performance data directly into your grid.
The syntax allows you to retrieve Open, High, Low, Close, and Volume (OHLCV data) over specific timeframes. Analyzing these historical arrays is essential for calculating asset return volatility and identifying long-term trends.
A modern approach: built-in real-time data with Quadratic
While Excel’s native tools are useful, modern platforms take this a step further by embedding real-time market data directly into the spreadsheet environment. Quadratic provides built-in access to live and historical stock data without requiring CSV imports or manual refresh cycles. This means your portfolio models and calculations update continuously in the background.
Beyond data access, Quadratic allows you to combine real-time market feeds with AI-powered analysis and dynamic visualizations in the same workspace. Instead of stitching together multiple tools, you can pull, analyze, visualize, and track stock data seamlessly.
Step-by-step: building a robust portfolio tracker
Fetching individual data points is only the first step. The next phase is constructing a cohesive stock portfolio tracking spreadsheet. A robust tracker requires several essential columns, including ticker, shares owned, and total value. Structuring your sheet this way creates a repeatable system where each asset is consistently tracked and easy to analyze.
Calculating profit, loss, and percentage returns
A tracking template needs to measure performance accurately. You can calculate unrealized gains or losses by subtracting your cost basis from the current total value. To find your percentage return, divide the unrealized gain by the initial cost basis.
Structure these formulas to reference your live data cells so they respond dynamically to price updates without breaking. Adding formatting in Excel makes the dashboard visually intuitive. Apply green text for positive returns and red text for negative returns to spot performance trends instantly.
Adding visualizations for trend analysis
Visual trend analysis separates a static list of numbers from a true accounting dashboard. You can use in-cell sparklines to visualize 30-day or 90-day price trends directly next to the ticker.
For a more detailed view, connect standard line charts to the data arrays generated by the STOCKHISTORY function. This allows you to see the trajectory of your investments at a glance. Visualizing these arrays makes it much easier to digest complex market movements.
Automating portfolio insights and alerts
To take your tracker a step further, you can introduce automated insights and alerts. This involves setting rules that flag unusual performance, such as sharp price drops, portfolio concentration risks, or deviations from your target asset allocation. Instead of manually reviewing your portfolio, your system proactively highlights what needs attention.
Platforms like Quadratic make this especially powerful by allowing you to layer in advanced logic, real-time data updates, and dynamic visualizations so your portfolio tracker evolves from a passive record into an active decision-support tool.
Moving beyond basic spreadsheets: advanced modeling in Quadratic
When you outgrow basic stock quotes in Excel and need comprehensive tracking, Quadratic provides the ideal environment. Quadratic allows you to blend native spreadsheet capabilities with built-in AI and programming language capabilities. Let’s explore the features of Quadratic in detail.
Build a portfolio engine with real-time stock market data
Quadratic provides built-in, real-time access to stock market data directly inside the spreadsheet. You can reference your holdings and instantly retrieve live prices, historical OHLCV data, and volume without configuring external APIs or importing CSV files.
This transforms your portfolio tracker into a continuously updating system. Your total portfolio value, individual position performance, and daily P&L are always synchronized with the market, allowing you to monitor your investments with the same level of precision as institutional tools.
Analyze risk and exposure with programming logic
Quadratic enables you to go deeper by combining native spreadsheet logic with Python and SQL to compute advanced metrics such as volatility, drawdowns, correlation, and portfolio diversification.
Instead of exporting your data into separate tools, you can run these calculations directly where your live market data resides. This creates a tightly integrated workflow where risk analysis is continuously updated alongside your portfolio valuations.
Automate updates and maintain a low-touch system
Manual maintenance is one of the biggest weaknesses of traditional portfolio spreadsheets. Quadratic removes this burden by allowing you control how your portfolio model refreshes in the background.
Market data updates, calculations recompute, and dashboards refresh without intervention. This creates a low-maintenance system that scales effortlessly as your portfolio becomes more complex, ensuring your analysis is always current without additional effort.
Use AI to interrogate and optimize your portfolio
Portfolio analysis often involves asking complex questions: which holdings are driving returns, where risk is concentrated, or how different scenarios might impact performance. Quadratic’s AI capabilities allow you to ask these questions directly and generate structured analyses without manually building every formula or code.
You can quickly compare assets across metrics like returns, volatility, and valuation, or simulate how changes in allocation affect overall performance. This significantly reduces the time required to move from raw data to actionable investment insights.
Let’s see how this works using the stock market analysis template in Quadratic:
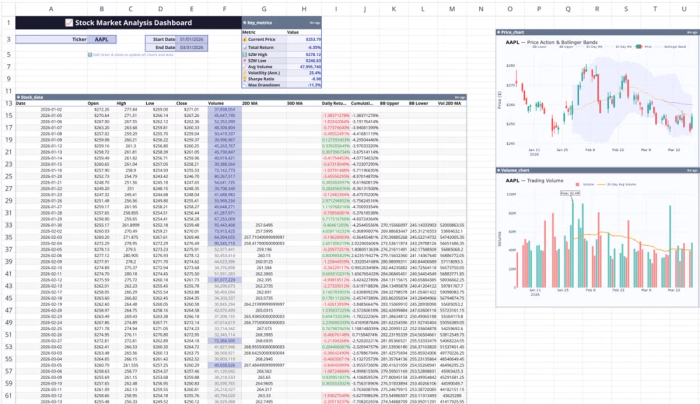
This template includes features for real-time stock data visualization, technical indicator calculations, price trend analysis, and more. All you have to do is input the stock ticker, and your data updates automatically across the board. Users can also perform custom analysis using text prompts. Here:
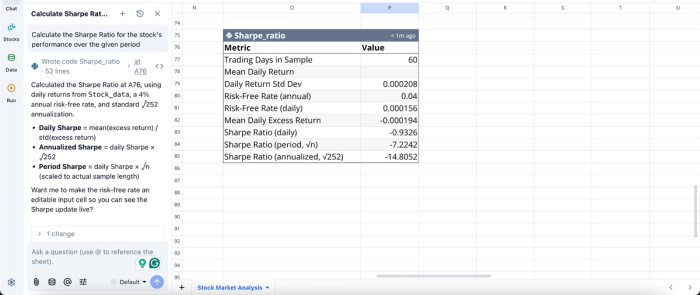
In this image, I ask Quadratic AI to “Calculate the daily percentage change in trading volume and identify days with significant volume spikes”. It instantly generates a table that gives a breakdown of volume spikes across the 30-day window, showing days where a spike occurs.
Visualize portfolio performance in real time
Clear financial data visualization is critical for understanding how your portfolio evolves. Quadratic enables you to generate performance charts, equity curves, and drawdown visualizations directly from live data within the spreadsheet.
Since the underlying data updates automatically, your charts remain current without any manual refresh. This allows you to continuously monitor trends and communicate performance effectively. Visualization in Quadratic can also be done using text prompts. Here:
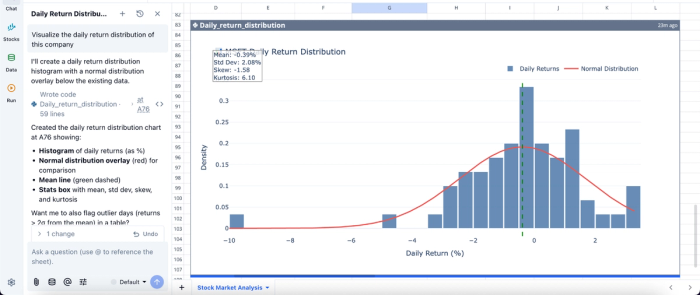
In this image, I ask Quadratic AI to “Visualize the daily return distribution of this company”. It creates a histogram of the daily returns alongside the normal distribution overlay. This helps analysts easily understand the insights generated from raw data.
Collaborate on portfolio strategy without version control issues
Portfolio tracking is not always a solo activity. Whether you are working with partners or managing shared capital, collaboration is essential. Quadratic’s real-time environment allows multiple users to interact with the same live portfolio model simultaneously.
It provides a collaborative analytics platform that eliminates version conflicts and ensures that everyone is working with the same up-to-date data and logic. It also makes it easier to review decisions and refine strategies together.
Conclusion
Transitioning from pulling stock data in Excel to constructing a dynamic portfolio tracker is a crucial step for financial analysis. Reliable portfolio management depends on repeatable workflows and comprehensive historical data. By moving past static numbers and embracing historical arrays, you can build a model that provides clear insights into your investments.
Quadratic allows you to seamlessly pull price history using its built in access to stock market data, then use AI to perform advanced analysis and generate interactive charts. Try Quadratic for free.
Frequently asked questions (FAQs)
How do I get stock quotes in Excel?
You can easily get live stock quotes in Excel by using the built-in Stocks data type. Simply type a ticker symbol into a cell, then convert it to a Stocks data type from the Data tab to pull current prices and other top-level metrics. This provides free stock quotes in Excel that update automatically for quick dashboard views.
Can I get stock quotes in Excel from Google Finance or Yahoo Finance?
While some users attempt to get stock quotes in Excel from Yahoo Finance or Google Finance through CSV imports or web scraping, native spreadsheet functions offer greater reliability. The article suggests that built-in tools generally provide better automation benefits compared to these external, often manual, methods. Relying on an outdated Excel stock quote add in can also cause issues.
How does Quadratic enhance the process of getting live stock quotes in Excel for portfolio tracking?
Quadratic streamlines the process of getting stock quotes in Excel by offering offering access to stock market data and integrating Python and AI. This allows users to go beyond basic price history to fetch broader macroeconomic datasets, company fundamentals, and technical indicators within the same spreadsheet environment.