James Amoo, Community Partner
Apr 30, 2026

Every growth, product, and revenue team knows the importance of mapping the customer journey. Yet, for most organizations, the data required to build a complete picture remains trapped in disconnected silos. You might have feature adoption in one tool, sales pipeline in another, and KPI tracking in a third.
The best dashboards for customer journey analysis transcend simple funnel analysis by unifying these disparate data sources. When you blend data across platforms, you reveal critical drop-offs and revenue drivers that would otherwise remain hidden.
This article explores how to move beyond basic reporting by mapping key lifecycle stages, solving the complex problem of identity stitching, and building actionable dashboards that drive precise interventions.
Moving beyond basic funnel reporting
Standard reporting templates often fall short because they lack a holistic view of the user. When teams rely on fragmented customer journey analysis tools, executives are forced to piece together a cohesive story from a dozen different screens. The most effective dashboards eliminate this friction by connecting behavioral product data directly to business data analysis and revenue outcomes.
Instead of looking at product clicks in isolation, a truly unified dashboard serves as a single source of truth for cross-functional teams. Growth, product, RevOps, and customer success teams can all look at the exact same data model. This ensures that when a user takes a specific action in the product, every department understands how that behavior impacts the bottom line.
A more advanced approach also introduces identity resolution and cohort analysis, allowing teams to track users seamlessly across devices and touchpoints. Rather than analyzing disconnected events, dashboards can reconstruct complete user journeys. This is critical for identifying friction points and attributing value accurately across the funnel.
Finally, modern dashboards should support real-time and exploratory data analysis rather than static reporting. Decision-makers need the flexibility to drill down into anomalies and iterate quickly without waiting on data teams for custom reports. With dynamic filtering, dashboards evolve from passive reporting tools into active decision systems that continuously inform and optimize the customer journey.
Essential metrics by customer journey stage
To build dashboards that truly reflect the customer journey, it’s not enough to track isolated product management metrics; you need to align measurement with each stage of the data analytics lifecycle. This approach ensures that every KPI is contextually relevant and tied to progression through the funnel. By structuring your dashboard around these phases, teams can diagnose bottlenecks and ultimately drive more predictable growth.
Acquisition and awareness
At the top of the funnel, the focus should be on how users discover your product and take their first meaningful action, often conceptualized within the AARRR Pirate Metrics framework. Rather than getting bogged down in endless debates over complex marketing attribution models, your dashboard should consolidate the data that matters most.
Track the initial touchpoints that lead a prospect to your website, and follow that thread straight through to initial account creation or signup. With the use of conversion tracking tools, teams can clearly see which acquisition channels are generating actual signups.
Activation and decision
Once a user creates an account, the clock starts ticking on activation. Your dashboard needs to track the specific steps a user takes to reach their "aha" moment or complete their first transaction.
Visualizing drop-off rates within the onboarding flow is critical here. If a large percentage of users abandon the product at a specific configuration step, your product team knows exactly where to intervene. Also, measuring time-to-value serves as a strong leading indicator of long-term success. The faster a new user realizes the core benefit of your product, the more likely they are to convert to a paid plan.
Retention and expansion
This stage of the lifecycle requires connecting ongoing product usage data directly to revenue outcomes and account health scores. To prevent revenue loss, your accounting dashboard should identify churn indicators before a cancellation actually happens.
Monitoring sudden drops in core feature engagement allows customer success teams to proactively reach out to at-risk accounts. Conversely, tracking product usage also highlights expansion opportunities. When a user's behavior indicates they are hitting usage limits or heavily utilizing premium features, the dashboard should flag this as an upsell trigger, signaling to sales that the account is ready for a higher tier.
Revenue and monetization
Beyond engagement, your dashboard must clearly quantify how user behavior translates into revenue. This includes tracking metrics such as conversion rates from free to paid plans, average revenue per user (ARPU), and customer lifetime value (LTV). These indicators help teams understand not just whether users are active, but whether they are contributing meaningfully to business growth.
A strong monetization layer also ties revenue events back to specific user actions and segments. For example, identifying which features or usage patterns correlate with higher conversion rates allows product and growth teams to double down on what drives revenue. This closes the loop between product and financial data analytics, ensuring that optimization efforts are directly aligned with profitability.
Advocacy and referral
The often overlooked stage of the journey is advocacy. This is where satisfied users become promoters of your product. Dashboards should capture signals such as referral activity, net promoter score (NPS), and organic sharing behaviors to measure how customers contribute to new user acquisition.
Tracking advocacy metrics provides a feedback loop into the acquisition stage, highlighting which cohorts are most likely to drive word-of-mouth growth. By identifying highly engaged and satisfied users, teams can design targeted referral programs or incentives that amplify this effect. Incorporating advocacy into your dashboard ensures that customer journey analysis extends beyond retention.
The technical challenge: Identity stitching across platforms
The most significant operational hurdle in building these dashboards is tracking a single user across multiple platforms, a key aspect of effective customer data management. This process, often referred to as identity stitching, is notoriously difficult. Matching an anonymous website visitor to a Mixpanel user ID, linking that to a Salesforce account, and finally connecting it to a QuickBooks billing profile requires precise logic.
Without establishing consistent definitions and a unified customer identifier, any dashboard will present a fractured and inaccurate view of the customer. Identity stitching ensures that a user's behavioral data, sales history, and financial standing are all accurately tied to the same individual.
A robust identity stitching strategy typically combines both deterministic and probabilistic matching techniques. Deterministic methods rely on exact identifiers such as email addresses, user logins, or customer IDs, while probabilistic approaches infer identity based on behavioral patterns, device fingerprints, or session data.
Teams must also define clear rules for identity precedence and data freshness to maintain consistency over time. As users change devices or interact through new channels, the system must continuously reconcile and update profiles without breaking historical continuity. This is what transforms identity stitching from a one-time integration task into a foundational capability for scalable customer journey analytics.
Streamlining customer journey analysis with Quadratic
Disconnected tools are the primary reason most customer journey dashboards fail to deliver real insight. Product analytics, CRM systems, and billing platforms each hold a piece of the story, but without a product analytics tool, teams are left reconciling inconsistent data and definitions. Quadratic addresses this by consolidating the entire analytical workflow into a single environment where data can be ingested and visualized together.
Direct connections to multiple data sources
Quadratic enables teams to pull live data directly from product analytics tools, CRM systems, and billing platforms into a single workspace. This eliminates the need to export datasets or rely on fragmented integrations that often introduce inconsistencies.
With all customer touchpoints centralized, teams can construct a complete view of the user journey without stitching together disconnected reports.
Scenario analysis and cohort exploration
Quadratic provides a powerful environment for exploring different customer scenarios, such as comparing cohorts by acquisition channel or testing the impact of onboarding changes. These analyses can be performed directly within the same workspace as your core data.
By enabling rapid experimentation, teams can move beyond static reporting and actively test hypotheses. This leads to more informed decisions and a deeper understanding of customer behavior.
AI-powered data analysis
Quadratic integrates AI agents for data analysis to help teams structure and analyze complex customer journey data. This includes tasks such as identity stitching, cohort analysis, and behavioral segmentation, all executed within the same environment.
By leveraging AI to generate and refine analytical logic, teams can quickly adapt to new business questions. This reduces reliance on rigid templates and allows for more nuanced, data-driven insights. Let’s see how this works.
I have some sample user data in Quadratic’s interface:
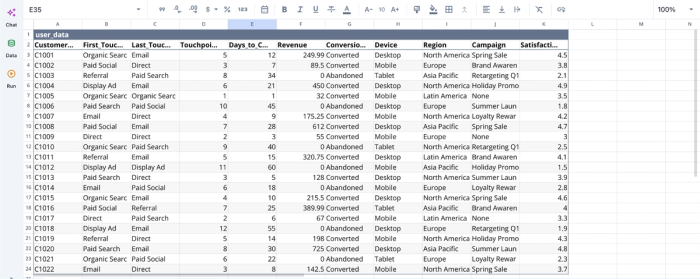
Once you import (or connect to) your data, you can immediately begin analysis in Quadratic; no extra setup is required. Here:
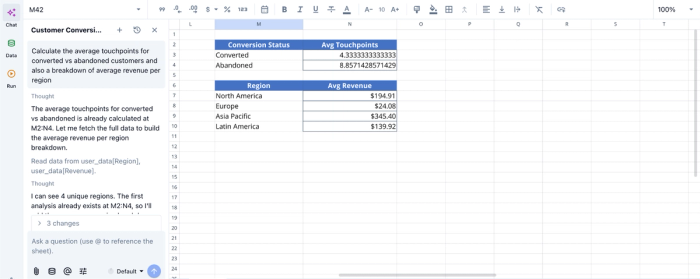
Here, I ask Quadratic AI, “Calculate the average touchpoints for converted vs abandoned customers and also a breakdown of average revenue per region”. It instantly generates two tables based on my prompts. With Quadratic, product managers and finance teams do not need technical expertise to perform advanced analysis and gain actionable insights from their data.
AI data visualization
Quadratic allows teams to build dynamic dashboards that visualize the entire customer lifecycle. From acquisition funnels to retention curves, visual outputs are directly tied to the underlying data and logic.
These visualizations update automatically as new data flows in, ensuring that stakeholders always have access to the most current insights. This makes it easier to identify drop-off points and growth opportunities. Creating visualizations in Quadratic can be done by using text prompts. Here:
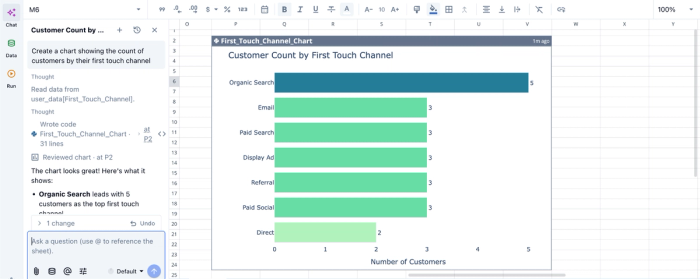
Here, I simply ask Quadratic to “Create a chart showing the count of customers by their first touch channel”. In seconds, it generates a bar chart that visualizes the customer count by their first touch channel. This approach helps to streamline communication for non-technical stakeholders.
Native support for programming languages
With built-in support for Python, SQL, and JavaScript, Quadratic provides the flexibility needed to model complex customer journeys. Teams can implement custom logic for attribution, scoring, and segmentation directly within the grid.
This eliminates the need for external processing tools and keeps all data transformation logic transparent. As a result, teams can maintain full control over how their data is structured and analyzed.
Real-time collaboration across teams
Quadratic is designed for cross-functional collaboration, enabling product, growth, finance, and data teams to work together in real time. Everyone operates on the same dataset and logic, reducing misalignment and duplicated effort.
This collaborative analytics platform ensures that definitions are consistent across the organization, improving the reliability of insights.
Conclusion
Unifying product, sales, and financial data into one cohesive narrative provides a massive strategic advantage. When you stop relying on fragmented customer journey analysis tools and start building a single source of truth, your organization can move from passive observation to revenue-driving interventions. The ability to see exactly how user behavior impacts your bottom line transforms how growth, product, and revenue teams operate.
With Quadratic, you can connect directly to your Mixpanel and your revenue data and build the best dashboards for customer journey analysis. Try Quadratic for free.
Frequently asked questions (FAQs)
What defines the best dashboards for customer journey analysis?
The best dashboards for customer journey analysis go beyond simple funnel charts by unifying product, sales, and billing data from disconnected silos. This comprehensive view reveals critical drop-offs and revenue drivers across the entire customer lifecycle, enabling precise interventions.
Why is unifying data essential when using customer journey analysis tools?
Unifying data is essential because fragmented customer journey analysis tools often present an incomplete picture of the user. Connecting behavioral product data directly to business and revenue outcomes provides a single source of truth, aligning cross-functional teams and enabling a holistic understanding of customer actions.
How does Quadratic help in building unified customer journey dashboards?
Quadratic addresses the challenge of disconnected data by allowing teams to pull live data from various sources into a single browser-based canvas. It provides the flexibility to perform complex identity stitching and data cleaning using Python, SQL, and formulas, ensuring that the best dashboards for customer journey analysis are always current and actionable.