
James Amoo, Community Partner
Apr 30, 2026

Table of contents
- Finnhub for stock market analysis
- Why teams evaluate Finnhub alternatives
- The core decision: API-first vs. analysis-first
- Key evaluation criteria for market data tools
- How Quadratic fits: a unified analysis environment
- Finnhub vs Quadratic for stock market analysis
- Conclusion: choosing your next market data solution
- Frequently asked questions (FAQs)
Teams often start looking to download historical stock data when they hit unexpected roadblocks. Restrictive rate limits or sudden API changes can quickly disrupt daily operations. When this happens, evaluating Finnhub alternatives becomes a priority.
As an alternative to API-first tools like Finnhub Python, Quadratic offers a more integrated approach. It combines built-in data access with Python and SQL analysis and spreadsheet-style workflows, reducing the need to manage separate APIs. This makes it a strong option for teams looking to move from raw data processing to actionable insights within a single environment.
This article covers the core evaluation criteria for market data tools, the two main approaches to handling financial data, and how modern workspaces are bridging the gap between developers and analysts. We’ll also see how Quadratic streamlines stock market analysis by providing a unified environment where users can ingest, analyze, and visualize financial data.
Finnhub for stock market analysis
Finnhub is a developer-focused financial data API that provides real-time and historical market data across equities, forex, cryptocurrencies, and economic indicators. It is designed to serve as a backend data source for applications, enabling users to access stock prices and alternative datasets such as news and social media signals.
Finnhub excels in scenarios where flexibility and customization are critical. For example, a developer can use its API to build a real-time stock tracking dashboard, integrate earnings calendar data into a trading model, or run fundamental and technical analysis. Similarly, quantitative analysts can leverage its historical data endpoints to backtest trading strategies or construct factor models.
Why teams evaluate Finnhub alternatives
Maintaining standard financial APIs often comes with significant operational burdens. Developers spend hours writing error-handling code, managing complex data transformation pipelines, and dealing with strict rate limits. As teams grow, these maintenance tasks eat into valuable engineering time.
A common catalyst for exploring Finnhub alternatives is the need for broader data sets. When analysts require deeper fundamental financials, often accessed via a financial statements API, existing pricing tiers might suddenly become cost-prohibitive. This creates friction between the developers tasked with building the infrastructure and the analysts who actually need to consume and model the data. Analysts want immediate access to information, while engineers need time to build reliable pipelines.
Another major factor is the growing demand for faster iteration and real-time insight generation. API-centric workflows often introduce latency. Every new dataset or transformation requires additional engineering effort, testing, and deployment. This slows down analysts who need to quickly adjust strategies in response to market movements.
Teams are also increasingly prioritizing unified workflows over fragmented architectures. Managing separate tools for data ingestion, storage, transformation, and visualization can lead to inefficiencies and inconsistencies across the organization. As a result, many teams begin to favor integrated platforms that reduce handoffs between financial data analytics and visualization, allowing both functions to operate more independently while still working within a shared environment.
Finnhub still offers strong value as a flexible and developer-friendly data source, particularly for building custom applications and lightweight data pipelines. For teams with in-house engineering resources, it remains a reliable option for accessing a wide range of financial datasets.
The core decision: API-first vs. analysis-first
When evaluating new market data providers, buyers face a primary decision axis. Do you need raw infrastructure to power a custom application, or do you need an environment optimized for prototyping and immediate analysis? Traditional comparisons often treat this as a strict binary choice. They force teams to compromise by choosing either the raw power of a developer tool or the usability of an end-user application.
API-first platforms (the infrastructure route)
The API-first approach is ideal for enterprise developers. It provides the necessary backend for building high-frequency trading applications, customer-facing dashboards, or complex proprietary databases. This route offers maximum flexibility and low latency.
However, it comes with hidden costs. An API-first platform requires dedicated engineering time for financial API integration, ongoing maintenance, and constant updates. Building robust infrastructure takes time, which inevitably delays the actual data analysis phase.
Analysis-first environments (the analyst route)
The analysis-first approach is tailored for financial professionals, quants, and analysts who rely on softwares for stock market analysis. These users need immediate access to data within a familiar interface. This approach bypasses heavy engineering requirements, allowing users to focus directly on analyzing and visualizing financial theories.
The traditional limitation of this route is performance. Traditional spreadsheets like Excel and Google Sheets often choke on large financial datasets. They also lack the programmatic power of a raw API, making it difficult to automate complex workflows or handle massive historical price tables. Quadratic addresses this gap by offering a familiar spreadsheet interface that allows users to seamlessly pull in live market data, then immediately perform AI-powered analysis and visualizations within the same environment
Key evaluation criteria for market data tools
Comparing providers requires a close look at both technical and operational criteria. Teams must assess several key factors before committing to a new solution.
- Data depth and variety: Ensure the alternative provides the necessary mix of real-time prices, historical data, and fundamental financials.
- Reliability and rate limits: Restrictive limits can break automated models during critical trading hours. Clear and predictable tiering is crucial for scaling your analysis.
- Integration complexity: Evaluate the total time-to-value. Factor in the time spent building robust data pipelines versus the time actually spent analyzing the data.
- Scalability and performance: As datasets grow in size and frequency, the platform should handle increased load without degradation.
- Workflow integration and usability: Beyond raw data access, consider how easily the tool fits into your existing analytical workflow. Solutions that combine data ingestion, transformation, and analysis in one environment reduce friction between engineering and research teams.
How Quadratic fits: a unified analysis environment
Quadratic is a modern solution that eliminates the traditional trade-off between API-first power and analysis-first usability. It combines the familiar grid of a spreadsheet with native Python execution. This allows users to pull rich financial datasets directly into their workspace. Let’s explore the features of Quadratic in detail.
Turn raw API data into structured research workflows
Quadratic connects directly to financial APIs, databases, and live stock market data, allowing you to pull price data, fundamentals, and alternative datasets into a structured grid instantly.
Rather than handling raw JSON responses manually, you can immediately transform and organize this data into analysis-ready tables. This removes the friction typically associated with API-based workflows.
Use AI to evaluate stocks across multiple dimensions
You can prompt Quadratic’s AI to compare companies based on revenue growth, profitability, valuation multiples, and other financial metrics. It can also help summarize trends across a portfolio or watchlist.
This shifts your workflow from manual computation to guided analysis. AI accelerates the process of identifying strong and weak performers without sacrificing transparency. Let’s see how this works using Quadratic’s built-in fundamental analysis template:
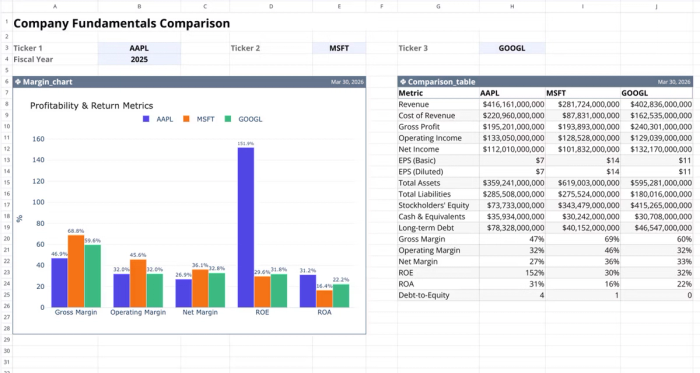
This template compares financial metrics for up to three companies across a single fiscal year. It automates data retrieval for income statements, balance sheets, and key financial ratios, allowing you to visualize profitability and return metrics side-by-side for quick stock comparisons. Users can perform advanced analysis by using simple text prompts:
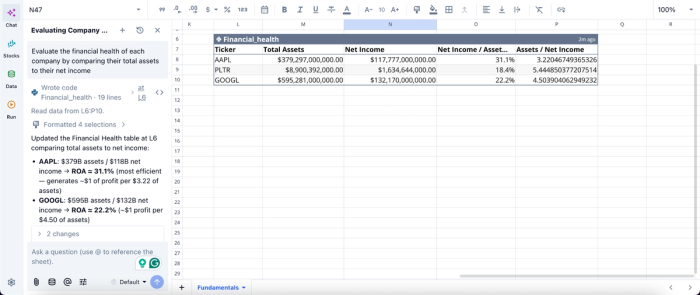
Here, I asked Quadratic to “Evaluate the financial health of each company by comparing their total assets to their net income.” It generates a table that gives insights into several metrics for all the tickers, including the total equity, ROA, and equity ratio.
Create dynamic charts tied directly to stock data
Quadratic enables you to build charts for price trends, financial metrics, and custom indicators that update automatically as new data flows in.
This ensures your financial data visualization is always aligned with the latest market conditions, without requiring manual updates. Visualization in Quadratic can also be done by using text prompts:
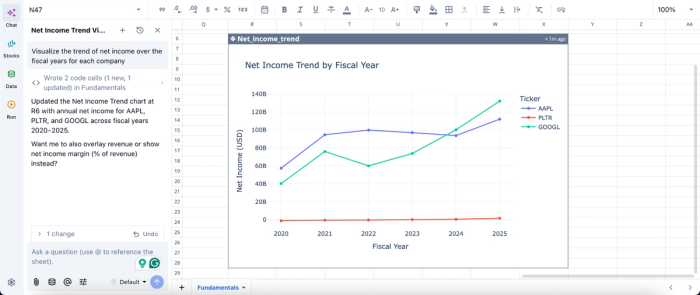
In this image, I ask Quadratic AI to “Visualize the trend of net income over the fiscal years for each company”. In seconds, it creates a chart that gives visual insights into the net income trend by fiscal year. This approach allows non-technical stakeholders to easily understand insights generated from stock market data.
Merge technical signals with fundamental insights
Quadratic allows you to analyze historical price data alongside financial statements within the same model. You can compute indicators like moving averages while evaluating earnings performance.
This enables a more balanced strategy, where both market behavior and business fundamentals inform your decisions.
Build advanced stock screeners with code-level control
Instead of relying on rigid filters, Quadratic enables you to build custom screening logic using Python and SQL for data analysis. You can define criteria that combine valuation, growth, and technical conditions.
This approach gives you full control over your investment filters, making it easier to adapt your strategy as market conditions evolve.
Collaborate on analysis without version control issues
Quadratic is a collaborative analytics platform where multiple users can work on the same dataset and models simultaneously.
This eliminates the need for sharing static files and reduces the risk of inconsistencies across different versions of the same analysis.
Finnhub vs Quadratic for stock market analysis
In this section, we’ll see how Finnhub and Quadratic compare, helping you choose the best tool for your workflow.
| Metric | Finnhub | Quadratic |
|---|---|---|
| Workflow | Raw data delivery via APIs requires additional tools to generate insights | Complete workflow: ingest, analyze, visualize, and market data in one environment |
| Implementation | Requires API integration, authentication, and custom scripting to get started | No heavy setup; users can start analyzing immediately in a spreadsheet-like interface |
| AI-driven research capabilities | No native AI layer; users must build or integrate their own analysis workflows | Built-in AI for comparing stocks, generating models, and summarizing trends across datasets |
| Handling financial + market data together | Provides endpoints, but combining datasets requires external engineering effort | Seamlessly combines financial statements, price data, and custom datasets in one model |
| Custom modeling and flexibility | Flexibility depends on external codebases; no built-in modeling environment | Native Python, SQL, and formulas allow deep customization directly in the workspace |
| Visualization | No native visualization layer; requires external BI tools or libraries | Integrated charts and dashboards that update automatically with live data |
| Collaboration | Real-time collaboration with transparent, auditable logic in a shared workspace | Developer-focused; collaboration happens outside the platform (code repos, files) |
Conclusion: choosing your next market data solution
The best choice among Finnhub alternatives depends entirely on your primary goal. You must decide whether your priority is building backend infrastructure or accelerating financial analysis. Modern workspaces offer a compelling third path for teams wanting API-level power without the burden of pipeline maintenance. Quadratic allows you to build your entire market data workflow in an integrated spreadsheet environment without worrying about complex API configuration processes. Try Quadratic for free.
Frequently asked questions (FAQs)
Why do teams evaluate Alpha Vantage vs Finnhub for market data?
Teams often evaluate Alpha Vantage vs Finnhub review due to restrictive rate limits, unexpected API changes, or the need for more cost-effective datasets. These issues can disrupt daily operations and consume valuable engineering time that could be spent on analysis.
What is the core difference between API-first and analysis-first data solutions?
The API-first approach provides raw infrastructure for developers to build custom applications, offering maximum flexibility but requiring significant engineering maintenance. In contrast, analysis-first environments are optimized for financial professionals, providing immediate data access within a user-friendly interface for direct modeling and visualization.
How does Quadratic address the challenges presented by traditional Finnhub alternatives?
Quadratic eliminates the trade-off between API-first power and analysis-first usability by combining a familiar spreadsheet grid with native Python execution. This allows users to pull rich financial datasets, leverage AI-generated code for analysis, and build models in a unified environment without managing separate API infrastructure.