
James Amoo, Community Partner
May 19, 2026

The sheer volume of financial news published every minute makes manual tracking impossible for modern finance teams. To maintain a clear view of the market, developers and analysts are increasingly relying on a stock market news API to build structured and actionable data feeds.
Building a reliable news feed requires more than just calling an endpoint and displaying a list of headlines. It requires a focus on data quality, efficient financial API integration, and robust data engineering. By structuring raw news data, teams can filter out irrelevant noise and build automated workflows for comprehensive financial reporting.
In this blog, you’ll learn how to evaluate and integrate a stock market news API effectively, how to transform raw headlines into structured datasets, and how to design dashboards that surface only meaningful market signals. Quadratic simplifies this process by letting you ingest news APIs, clean and structure data with Python, and build live investment portfolio dashboards in one environment.
Why financial workflows need a programmatic news feed
The shift from manually reading headlines to programmatic monitoring has fundamentally changed how analysts and finance teams operate. Relying on human curation is slow and prone to oversight. By integrating a news API for stock portfolio tracking, teams can automate data processing and ensure they never miss a critical update.
Programmatic news feeds support several core use cases for modern finance teams, including robust stock market analysis. They are the foundation for building unified financial dashboards, tracking competitor announcements, and conducting automated sentiment analysis at scale.
More importantly, structured news feeds help investors filter out the overwhelming noise of the broader market. Instead of sifting through general market commentary, analysts can configure their feeds or use a stock screener API to focus strictly on the specific events, sectors, or companies that impact their active portfolios.
Evaluating providers: What makes a good stock market news API?
Selecting the right data provider is the first step in building a reliable monitoring workflow. When evaluating an API, developers should focus on four primary decision axes: data coverage, metadata tagging, filtering capabilities, and ease of data integration.
Many developers start with a free stock market news API to test endpoints and validate their initial code, rather than trying to scrape stock data. While a stock market news API free tier is excellent for prototyping, these options often come with strict rate limits or limited historical data. Upgrading to a paid tier is usually necessary for production-grade workflows that require high uptime and extensive historical archives.
Clean metadata is arguably the most valuable feature of a premium provider. APIs that deliver articles with pre-tagged ticker symbols and event types save significant development time. This built-in structuring prevents developers from having to build complex natural language processing pipelines just to figure out which companies an article mentions.
Building an actionable stock news feed
Moving from raw API responses to a usable data feed is a data management challenge common across many financial API use cases. Building a reliable feed requires active structuring and data processing, not just a single successful API call.
Querying by ticker, sector, and press releases
Structuring your API calls correctly is the most effective way to filter out irrelevant market noise. A broad sector query is useful for general market monitoring or identifying macro trends within an industry. However, highly targeted ticker or press release queries are much more effective for specific portfolio tracking.
To ensure relevant news data exploration, follow these best practices for query parameters:
- Limit queries to specific event types, such as earnings reports or official press releases, to avoid opinion pieces.
- Use precise date and time parameters to fetch only new articles since the last successful API call.
- Combine ticker parameters with keyword filters to narrow down news to specific product launches or executive changes.
Handling ticker mapping and data deduplication
Basic API documentation rarely addresses the downstream data management challenges of consuming news feeds. One of the largest hurdles is ticker mapping. Financial news often references varied company names or unlisted subsidiaries. Mapping these varied entities back to standard ticker symbols is critical for connecting news to specific stock assets.
Data deduplication is another major hurdle. Syndicated financial articles frequently get published across multiple news outlets simultaneously. Without a deduplication strategy, your feed will be cluttered with identical stories. Developers can manage this by hashing article titles and publication timestamps, or by filtering based on the source URL.
Enhancing raw feeds with AI and sentiment scoring
Raw article text and headlines can be transformed into measurable financial insights using AI. By passing news data through large language models, developers can extract structured data points from unstructured text.
Sentiment scoring is one of the most common applications of this technique. AI can analyze the tone of an article and categorize the news as positive, negative, or neutral. This allows finance teams to track the shifting public perception of a company over time. Additionally, AI summaries can drastically reduce the time analysts spend parsing complex press releases by distilling them down to a few key bullet points.
Building a transparent news tracker in Quadratic
Quadratic provides the ideal environment for pulling, structuring, and analyzing news APIs without the need to set up complex backend infrastructure. As an AI-powered spreadsheet, it allows users to connect directly to databases and APIs in a browser-based canvas. Let’s explore the features of Quadratic in detail.
Connect financial news APIs directly into your analysis layer
A modern news monitoring system is only as useful as its ability to unify scattered information into a structured format. Quadratic enables you to connect directly to stock market news APIs, RSS feeds, and financial data providers and stream raw headlines straight into the spreadsheet grid.
Instead of building and maintaining a separate backend pipeline, you can ingest structured and unstructured news data directly alongside market prices, fundamentals, and portfolio holdings to bridge fundamental analysis vs technical analysis. This turns fragmented news flow into a continuously queryable dataset that sits at the center of your investment portfolio spreadsheet.
Automate continuous news ingestion and monitoring
News flows constantly, and manual refresh cycles quickly become unsustainable. Quadratic supports scheduled workflows that automatically fetch, process, and update news data in the background.
This ensures your Python stock tracker remains continuously up to date without manual intervention. Whether monitoring earnings seasons or breaking company-specific news, your dashboard stays current by design.
Structure raw headlines into usable financial signals with Python
Financial news is inherently unstructured, which makes it difficult to integrate into traditional models. Quadratic solves this by allowing you to process news data using native Python and SQL directly inside the spreadsheet.
You can parse API responses, extract key entities (tickers, companies, sectors), and normalize inconsistent data formats from a financial statements API without leaving the workspace. This enables you to transform raw headlines into structured signals such as event types, macroeconomic references, or sentiment classifications.
AI-driven news impact analysis and summarization
With Quadratic, AI can be applied directly to your stock market news API data to convert raw headlines and articles into decision-ready summaries. Instead of manually reading and tagging news items, you can use AI spreadsheet analysis workflows to distill each entry into consistent outputs such as earnings highlights, macroeconomic developments, or company-specific events.
Beyond summarization, Quadratic enables AI-driven news impact analysis, which can be used to build an AI stock picker, by linking structured news data with live or historical market information in the same grid. You can evaluate how specific events correlate with price movements and quantify their short-term or long-term impact.
Let’s see how this works using the stock research template in Quadratic:
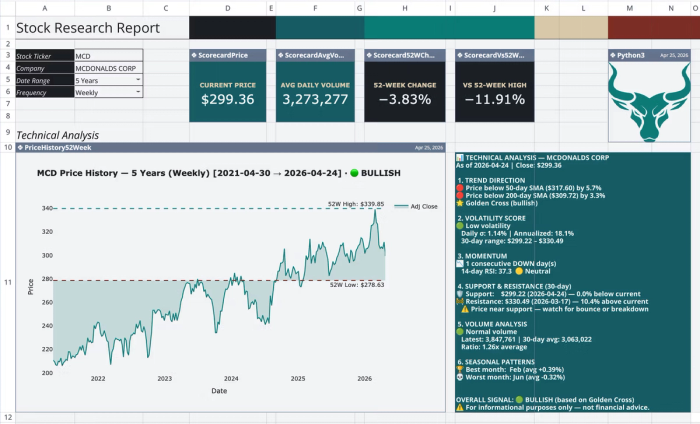
This template provides a single-ticker financial research dashboard for comprehensive financial reporting, organized across four sheets. It automates the retrieval of historical price data and the calculation of technical indicators directly within the spreadsheet. Users can also pull stock news data directly from the spreadsheet and analyze it using Quadratic’s built-in AI. Here:
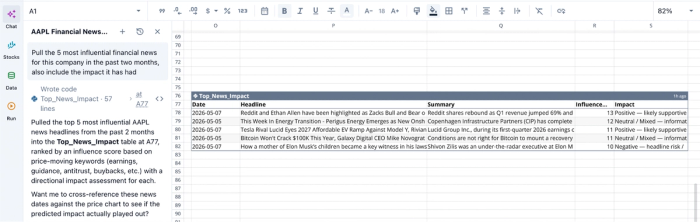
In this image, I ask Quadratic AI to “Pull the 5 most influential financial news for this company in the past two months, also include the impact it has had.” It instantly generates a table that displays the top 5 news, alongside its influence and a conclusion on its impact.
Build real-time dashboards for market event monitoring
Once structured, your news data can be transformed into dynamic dashboards and financial data visualizations. Quadratic allows you to build different charts that track news volume over time, sentiment distribution across sectors, or the correlation between headlines and price spikes.
These dashboards are directly tied to live data feeds, which means they update automatically as new events occur. This makes it possible to monitor market-moving developments in real time without rebuilding reports or refreshing external tools, rivaling the best data analysis tools.
The result is a continuously evolving market intelligence layer built directly on top of your raw news data. Stock news visualizations in Quadratic can also be done by using text prompts:
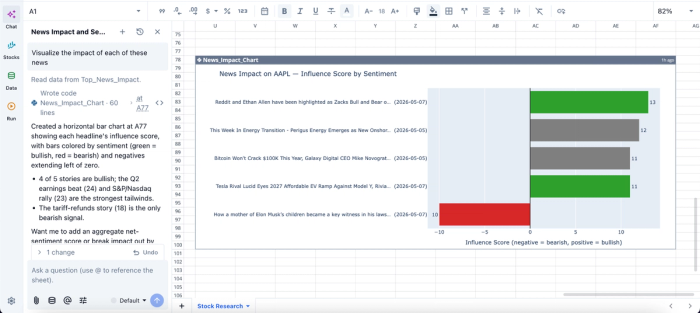
In this image, I ask Quadratic AI to “Visualize the impact of each of these news.” In seconds, it creates a chart that visualizes the impact of each news item on that particular stock. This helps non-technical stakeholders to easily get an understanding of their stock portfolio.
Collaborate on market intelligence in real time
Financial news analysis is often a shared responsibility across research teams, traders, and analysts. Quadratic enables real-time collaboration directly inside the workspace, allowing multiple users to annotate news items and refine analytical models simultaneously.
Instead of working across disconnected tools and spreadsheets, teams operate within a collaborative analytics platform where insights are immediately visible and actionable.
Conclusion
A reliable stock market news API is a foundational component of modern market intelligence workflows. By transforming raw headlines into structured, searchable, and analyzable datasets, organizations can reduce information overload and react to critical market developments with far greater speed and precision.
Quadratic makes this process significantly more scalable by unifying API ingestion, Python-based data processing, AI-assisted analysis, and live dashboard creation inside a single collaborative workspace. It allows you to build a smarter stock market news API workflow that turns raw financial news into actionable market intelligence. Try Quadratic for free.
Frequently asked questions (FAQs)
What should I look for when evaluating a news API for stock market tracking?
When evaluating a news API for stock market tracking, focus on comprehensive data coverage and ease of integration. Prioritizing providers with clean metadata can significantly reduce development time by pre-tagging critical information like ticker symbols and event types.
Can a free stock market news API be used for production-grade financial workflows?
While a free stock market news api is excellent for prototyping and testing initial code, these options often have strict rate limits or limited historical data. For reliable workflows that require high uptime and extensive archives, upgrading to a paid tier is typically necessary.
How does Quadratic help in leveraging a stock market news API for financial monitoring?
Quadratic provides an AI-powered spreadsheet environment that allows users to pull, structure, and analyze data from a stock market news API without needing complex backend infrastructure. It enables combining news feeds with live stock prices and fundamental data, using AI-generated Python workflows for deeper insights and real-time collaborative analysis.