
James Amoo, Community Partner
May 19, 2026

Transforming raw API responses into reliable financial reporting is a challenge that requires more than just a successful network request. When developers and analysts pull Polygon stock data, the gap between raw JSON output and a trustworthy financial model can be significant. Bridging that gap requires a structured, transparent, and repeatable workflow.
To build investment dashboards that stakeholders can actually trust, you must establish a clear journey for your data. This process moves from extracting specific market data types to designing robust validation logic, and finally, to building a unified presentation layer where every calculation can be traced and verified.
Why auditable workflows matter for market data
It is easy to grab an API key, write a quick script, and pull a few years of price history rather than attempting to scrape stock data. However, when a financial model outputs an unexpected valuation or a dashboard displays a sudden spike, tracing that anomaly back to its source is often a nightmare. Analysts frequently find themselves untangling undocumented scripts and handling stale data.
Auditable workflows eliminate this uncertainty. By designing a pipeline where every extraction, transformation, and calculation is visible, you ensure that your financial insights are built on a solid data infrastructure and analytics strategy. An auditable workflow means that any reviewer can inspect the logic used to clean the data, verify the formulas used for analysis, and trust the final reporting.
Quadratic directly addresses this by keeping data ingestion, transformation logic, and analysis in a single transparent workspace. Instead of hiding logic inside separate Python scripts for a Python stock tracker or external databases, every step lives in the same environment. This makes it possible to trace any result back to its exact inputs and transformations.
Navigating the mechanics of Polygon.io ingestion
Working with financial API integration in a production or research environment involves practical realities that go beyond simple data requests. Effective stock market analysis requires handling bulk downloads efficiently and strictly managing API limits to avoid connection drops.
Before building downstream models, it is crucial to plan your data analytics strategy. A stable data pipeline anticipates the constraints of the source. For instance, requesting decades of daily pricing for the entire S&P 500 in a single call will likely result in timeouts or rate limit errors. Instead, structuring your queries to pull manageable batches of Polygon stocks—a key consideration when evaluating Polygon.io vs Alpha Vantage—ensures that your ingestion process remains stable and your models stay populated.
For foundational financial analysis, specific Polygon.io endpoints provide the most value by supplying structured datasets that feed directly into standard valuation and reporting workflows. Alongside this, reference data such as ticker metadata is essential for correctly mapping company identifiers and ensuring consistency across datasets when working with multiple sources.
The hidden risks of unstructured financial data
Dumping schema-free API responses directly into a financial model is a dangerous practice, given the significant impact of data quality on financial analysis. Without intermediate checks, you expose your analysis to hidden errors that can easily compound over time.
Common pitfalls of unstructured data include type conversion errors, where a system misinterprets a numeric price as a text string. Missing values are another frequent issue, particularly when dealing with market holidays or halted trading days that return null values instead of expected pricing data. Relying on manual intervention to fix these bottlenecks slows down analysis and introduces the risk of human error. Rigorous data validation, guided by essential data validation principles, is a critical requirement for compliant and reliable financial systems.
Designing a transparent validation workflow
Moving from raw JSON responses to structured model inputs requires a deliberate validation workflow that filters out inconsistencies before they reach any downstream financial model or dashboard. Without this layer, even high-quality market data can introduce subtle errors that compound across calculations.
A robust validation process begins with automated exception handling to manage API timeouts and malformed requests without breaking the entire pipeline. It also includes strict data type validation to ensure consistency across the dataset. These checks create a predictable data structure that downstream models can safely depend on.
Finally, missing data protocols define how gaps in financial time series should be treated. By explicitly documenting and automating these decisions, you create a transparent transformation layer that contextualizes your Polygon stock API data within a controlled error-handling framework. This ensures every step is auditable, allowing analysts and stakeholders to trace outputs back to validated inputs and trust the integrity of the final dataset.
Unifying your workflow with Quadratic
The biggest friction point in market data analysis is often the fragmentation of tools. Extracting data in a standalone script, validating it in another environment, and building models in a traditional spreadsheet creates a fragile pipeline, leading many to seek a MarketXLS alternative. Quadratic serves as the ideal workspace to bridge the gap between raw API ingestion and final financial reporting. Let’s explore the features of Quadratic in detail.
Pull multiple financial datasets into one unified environment
Stock market analysis rarely depends on pricing data alone. Analysts need to contextualize market activity with earnings reports, macroeconomic indicators, and analyst estimates. Quadratic makes this possible by allowing multiple live stock market data and financial datasets to coexist inside one continuously updating spreadsheet environment.
You can combine the Polygon stock forecast with fundamentals or portfolio exposure models in your investment portfolio spreadsheet without maintaining separate databases or synchronization pipelines. This architecture enables analysts to build far more comprehensive research workflows while eliminating the friction of moving data across disconnected systems.
Automate repeatable market research workflows
Maintaining current market analysis often requires scheduled scripts and external orchestration tools. Quadratic simplifies this operational burden through built-in spreadsheet automation and scheduled tasks capabilities.
This transforms a static spreadsheet into a continuously updating financial research system capable of supporting long-term investment workflows, tracking stock, and recurring reporting.
Build advanced quantitative workflows with native Python
Quadratic combines spreadsheet accessibility with native Python and SQL execution, making it possible to build sophisticated analytical systems directly inside the browser. Analysts can compute rolling volatility, factor exposures, and portfolio optimization workflows directly on top of live Polygon stock screener data.
Unlike traditional spreadsheet environments that struggle under computational complexity, Quadratic allows fundamental and technical data to coexist in the same workspace. This makes it significantly easier to maintain reusable financial models while preserving visibility into every transformation and assumption.
Use AI to accelerate market analysis and validation
Quadratic’s AI capabilities help reduce the manual workload associated with financial modeling, market research, and building an AI stock picker. Analysts can use AI to generate Python code for retrieving and structuring data from a Python stock market API, summarize earnings commentary, or compare valuation metrics across watchlists directly in the grid.
The AI layer also improves workflow validation. Instead of manually reviewing large datasets line by line, analysts can prompt the system to detect missing values, identify inconsistent schemas, or classify news events from a stock market news API automatically.
Let’s see how this works using the technical analysis template in Quadratic:
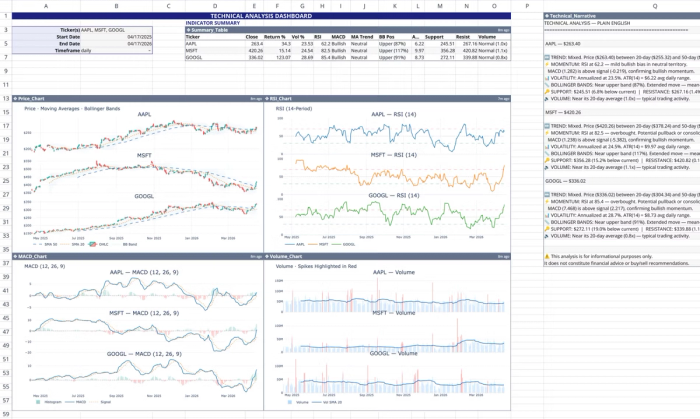
This template functions as a self-contained live market dashboard within Quadratic. It automatically pulls real-time and historical stock data using Quadratic's stock market data API to calculate and visualize 12 standard technical indicators. Users can also perform custom analysis by simply asking questions:
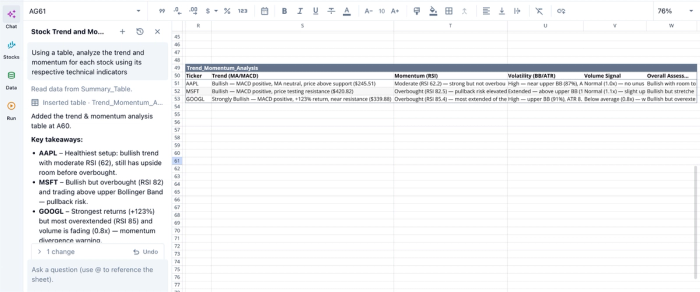
In this image, I prompt Quadratic AI to “Using a table, analyze the trend and momentum for each stock using its respective technical indicators.” It instantly creates a table that gives insights into the trend momentum analysis with metrics such as momentum, volatility, and volume.
Create live dashboards connected directly to market data
Financial dashboards, including the best accounting dashboard for financial reporting, become far more valuable when they remain directly connected to live market feeds. Quadratic allows analysts to build dynamic financial data visualizations directly on top of API-connected datasets without exporting information into external BI tools or dashboarding platforms.
You can visualize intraday price movement, earnings trends, or portfolio allocation changes directly beside the underlying calculations and Python scripts. Visualization in Quadratic can also be done using text prompts:
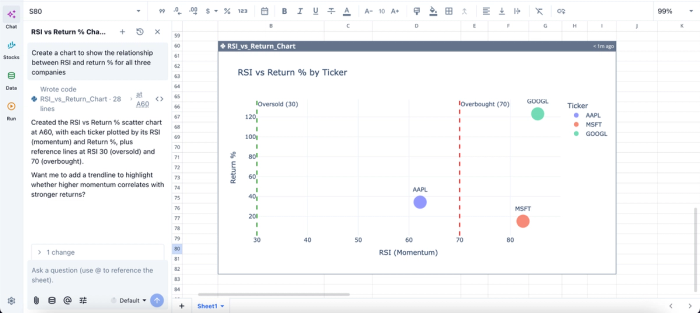
In this image, I ask Quadratic AI to “Create a chart to show the relationship between RSI and return % for all three companies.” In seconds, it creates an RSI vs return chart based on the stocks present in our dataset.
Collaborate on transparent investment research
Financial analysis is increasingly collaborative, especially across research, portfolio management, and operations teams. Quadratic enables real-time multiplayer collaboration where all users work from the same centralized analytical environment.
Analysts can review assumptions and refine workflows collaboratively while maintaining complete transparency into how every result was produced.
Conclusion
Transforming raw market data into trustworthy financial insights requires more than just a successful API call. It demands a structured pipeline that prioritizes validation and repeatable processes. Moving from raw extraction to a fully auditable workflow is the only way to ensure consistency and transparency for your financial models.
By bringing your ingestion, validation, and presentation into a single environment, you eliminate the risks of disconnected tools and manual errors. With built-in access to stock market data ingestion, AI capabilities, spreadsheet formulas, and programming languages, Quadratic allows you to perform robust stock market analysis within a familiar spreadsheet environment. Try Quadratic for free.
Frequently asked questions (FAQs)
Why is data validation important when working with the Polygon stock news API?
Without rigorous data validation, raw Polygon stock data can introduce hidden errors like type conversion issues or missing values, which can compound over time. A transparent validation workflow acts as a filter, catching these anomalies before they impact financial models or dashboards.
How does Quadratic simplify working with Polygon stock data workflows?
Quadratic unifies the entire workflow, allowing users to pull Polygon stock data using native Python, then clean and validate it with SQL and formulas directly within the spreadsheet grid. This integrated environment makes the pipeline transparent and repeatable, enabling immediate construction of auditable dashboards and models without switching tools.
What key data types are typically used for financial modeling with Polygon stock data?
For foundational financial analysis, essential Polygon stock data types include daily open, high, low, close, and volume (OHLCV) aggregates, along with reference data like ticker details. Corporate actions such as stock splits and dividend payouts are also crucial for accurately adjusting historical pricing.