
James Amoo, Community Partner
Jun 1, 2026

Table of contents
- What AI actually does well in personal finance
- The data-ingestion problem nobody talks about
- Step 1: Pull your transactions into a spreadsheet you control
- Step 2: Use AI to categorize transactions
- Step 3: Detect recurring charges and spending anomalies
- Step 4: Build a cash flow view (timing, not just totals)
- Step 5: Assemble your spending and net worth dashboard
- How Quadratic fits as your AI personal finance assistant
- Start building your own AI personal finance dashboard
- Frequently asked questions (FAQs)
If you've ever scrolled through your bank app at the end of the month and thought, "Where did it all actually go?" you're not alone. Your bank already records every transaction, every transfer, every recurring charge. The problem is that this data sits in a format that doesn't tell you anything meaningful about how you live or spend.
Bank apps show you a stream of transactions. Budgeting apps show you neat category pies. Neither shows you the full picture, and neither lets you shape that picture to fit your life. You end up with snapshots that someone else designed, on someone else's schedule.
This is where AI personal finance tools change the equation. With the right setup, AI can take a raw export of bank transactions and turn it into categorized summaries, cash flow views, and anomaly alerts inside a spreadsheet you build and own. Instead of hoping a personal finance AI app gets your categories right, you define the logic, inspect it, and refine it as your habits change.
What AI actually does well in personal finance
Before building anything, it helps to be specific about where AI for personal finance genuinely earns its keep. It's not magic, and it's not a financial advisor. But it is excellent at a handful of tasks that used to consume hours of manual spreadsheet work.
Categorizing messy transaction descriptions at scale, including cryptic merchant strings, payment processors, and one-off vendors. Detecting recurring charges and surfacing anomalies, like a subscription that quietly doubled or a utility bill that spiked. Summarizing cash flow timing rather than just totals, so you can see when money lands and when it leaves. Generating reusable logic that you can read, rerun, and modify month after month.
The role of AI in personal finance, at least in the practical sense, is to compress repetitive analysis into prompts and reusable code. You stay in charge of what the categories mean and which trends matter.
The data-ingestion problem nobody talks about
Almost every spreadsheet-based system starts with the same ritual, and without a reliable approach to transaction tracking, the monthly habit collapses by month three. Log into each bank, download a CSV, clean up the columns, and paste it into the master sheet. Do this across two checking accounts, three credit cards, and a savings account, and the monthly habit collapses by month three.
Without structured transaction data, no AI analysis is useful. You can't detect anomalies in data you haven't refreshed. You can't track cash flow timing on a snapshot from six weeks ago. The categorization logic might be brilliant, but if it's running on stale data, the dashboard never reflects reality.
Quadratic helps by combining spreadsheet workflows with live financial data connectivity via its Plaid integration, coupled with Python, SQL, and AI-assisted analysis in the same environment. Instead of relying entirely on manual CSV exports, users can build repeatable workflows where transaction data, categorization logic, and financial data visualization stay connected and updateable inside a single collaborative spreadsheet workspace.
Step 1: Pull your transactions into a spreadsheet you control
The first build step is making sure your data lands in the spreadsheet without manual lifting. In Quadratic, you connect your bank and credit card accounts through the Plaid integration, and transactions and balances sync directly into cells. There are no CSV downloads, no column reformatting, and no broken date parsing.
Before moving on, it helps to confirm a few foundational pieces: pull at least three to six months of history so the AI has enough signal for categorization and recurring-charge detection, and include checking, savings, credit cards, and any other cash-flow-relevant accounts so the dashboard reflects the full financial picture.
The other important decision is refresh cadence. A weekly refresh is usually enough for a monthly financial reporting and trend tracking, while more active budgeting workflows may benefit from more frequent updates. Once your transactions are sitting directly in cells, you have the continuously refreshable dataset that an AI powered personal finance assistant actually needs in order to categorize spending and generate reusable financial analysis workflows.
Step 2: Use AI to categorize transactions
With raw transactions in place, the next step is turning them into categories that mean something to you.
Prompt the AI to classify each transaction into a category schema using automatic transaction categorization logic that organizes raw data into meaningful groups; this is the foundation of any useful category spend analysis. The key here is that AI shouldn't just write a category in a column and walk away. Have it generate categorization logic in a Python block or a formula you can read.
This matters because a good AI-powered personal finance assistant should be auditable. When the logic is right there in the sheet, you can scan it, find the rule that miscategorized your favorite coffee shop as "office supplies," and fix it in seconds. Compared to a closed budgeting app or spreadsheet, this is the difference between debugging and shrugging.
Once the first pass looks good, review edge cases. Refine the prompt or the rules until the schema feels stable, then lock it in. You'll reuse the same category schema every month, which is what makes month-over-month comparisons meaningful.
Step 3: Detect recurring charges and spending anomalies
Once transactions are categorized, you can use AI to compute typical spend per category over the last three to six months, including the average and a sense of variance. From there, you can flag categories where this month is meaningfully higher or lower than the baseline and identify recurring subscriptions by detecting transactions that repeat at consistent intervals and amounts, like trial subscriptions that converted or services you stopped using months ago.
You can also distinguish intentional one-offs (a flight, a gift) from true anomalies (a duplicate charge, a price hike). The output should be a simple alerts table you can scan in seconds: category, amount, baseline, deviation, and a short note. This is the part of the dashboard you'll actually look at when you sit down for a financial statement review.
Step 4: Build a cash flow view (timing, not just totals)
Most budgets fail not because totals are wrong, but because timing is wrong. You can be net positive for the month and still hit a tight Tuesday because three bills landed before payday.
The cash flow analysis dashboard is where you make timing visible. Lay out income inflows and outflows by week or pay period, depending on how you get paid. Use the connected balance data to show how your accounts move through the month, not just where they land at the end.
Then ask AI to summarize the patterns in plain language. Something like: "Outflows cluster in the first week of the month due to rent and recurring subscriptions, leaving the third week as the tightest period." Once you can see those pressure points, you can connect them back to category spend and decide what to shift.
Step 5: Assemble your spending and net worth dashboard
Now you bring it all together on one sheet. The components you've built can sit side by side: category summaries from Step 2, anomaly alerts and recurring charges from Step 3, cash flow charts and timing summaries from Step 4, and balance trends and net worth tracking are computed from the connected account balances.
Use AI to generate different charts directly in cells, and to write short narrative summaries that update each time you refresh the data ("Spending was 8% higher than your three-month average, driven by dining and travel"). The goal is a dashboard you design once and refresh with live data going forward, not a one-off analysis you abandon.
Net worth tracking is worth calling out. Because your account balances are syncing live, a bank account balance spreadsheet gives you a net worth trend without any extra plumbing.
How Quadratic fits as your AI personal finance assistant
Quadratic is built for exactly this kind of workflow. The Plaid integration removes the CSV bottleneck, so live transaction and balance data land in your spreadsheet automatically. From there, AI generates the categorization, anomaly detection, and summary logic directly in cells and Python blocks you can inspect and edit. Let’s explore the features of Quadratic in detail.
Connect live financial data directly into your dashboard
Most personal finance workflows break down at the import stage. Bank exports arrive as CSV files with inconsistent merchant names, duplicate transactions, missing categories, and formatting issues that require manual cleanup before any meaningful analysis can happen.
Quadratic removes much of that friction by connecting directly to live financial data sources through its Plaid integration. Transactions, balances, and account activity flow directly into the spreadsheet environment automatically, turning the spreadsheet into a continuously updating financial workspace rather than a static monthly snapshot.
That changes the nature of the workflow. Instead of rebuilding a budget tracker every month, you maintain a living financial model that evolves alongside your spending behavior.
Detect anomalies and financial risks automatically
One of AI’s most practical strengths in personal finance is anomaly detection. Humans are bad at spotting subtle spending drift over time, especially across hundreds or thousands of transactions.
Quadratic can use AI and Python together to identify unusual spending patterns, detect recurring subscriptions that changed price unexpectedly or flag transactions that fall outside normal behavioral ranges.
A sudden increase in food delivery spending, a forgotten SaaS subscription, or an unusually high utility bill becomes visible automatically through alerts or visual dashboards built directly into the spreadsheet.
Build custom financial models with Python and SQL
Most budgeting applications stop at dashboards and predefined categories. Personal finance becomes significantly more powerful once you can build your own analytical models directly on top of the underlying data.
Quadratic supports native Python and SQL directly inside spreadsheet cells, making it possible to create custom finance workflows that go far beyond standard budgeting apps. You can calculate rolling cash flow forecasts, build debt payoff simulations, model emergency fund scenarios, track investment allocations, or estimate future savings trajectories using real transaction history.
A freelancer might use Python to separate business and personal expenses automatically and project monthly cash reserves. Someone managing debt payoff goals could model different repayment strategies using interest-rate assumptions and payment schedules. A household managing multiple accounts could forecast seasonal spending spikes and evaluate long-term savings goals.
Use AI to categorize and analyze spending patterns
Raw transaction feeds are rarely analysis-ready. Merchant descriptions are inconsistent, and recurring subscriptions often appear under slightly different names across billing cycles.
Quadratic uses AI agents for data analysis directly inside the spreadsheet to generate categorization logic and surface patterns that would otherwise require hours of manual review. You can ask the AI to classify transactions like groceries, utilities, subscriptions, dining, or transportation, then refine the logic directly in the grid if something looks incorrect.
The important distinction is transparency. The categorization rules remain visible and editable. If a recurring transaction gets mislabeled, you can inspect the formula or Python logic driving the classification and adjust it immediately. Nothing disappears into a black-box recommendation engine. Let’s see how this works.
First, I connect to my bank account (via Quadratic’s Plaid integration):
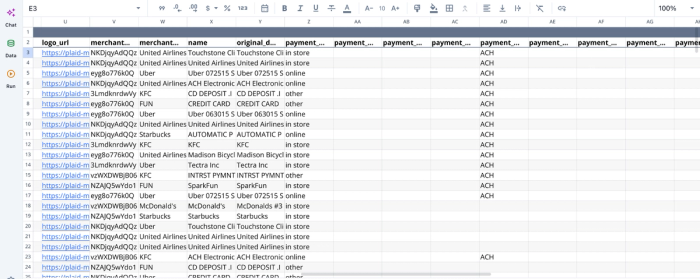
After successfully connecting to the financial data, we can immediately begin analysis:
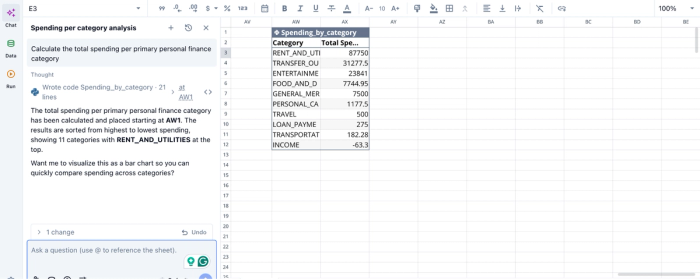
In the image above, I ask Quadratic AI to “Calculate the total spending per primary personal finance category”. It generates a table that shows the breakdown of my expenses across 10 categories. Users can ask any question about their data and get instant results in Quadratic.
Visualize your financial life with live dashboards
Financial data becomes significantly more useful once trends are visualized clearly. Static spreadsheets filled with rows of transactions rarely communicate how spending habits evolve.
Quadratic supports native charts and AI-assisted visualization directly inside the same workspace where the financial data lives. Users can build dashboards tracking monthly spending trends, savings-rate progress, debt reduction, investment allocation, subscription growth, or income volatility without exporting data into another BI tool.
A user might maintain a dashboard showing discretionary spending by category and net cash flow projections updated automatically from connected accounts. Someone focused on financial independence could track investment growth and long-term forecasting models in real time.
Let’s see how we can create a visualization for the analysis we conducted earlier:
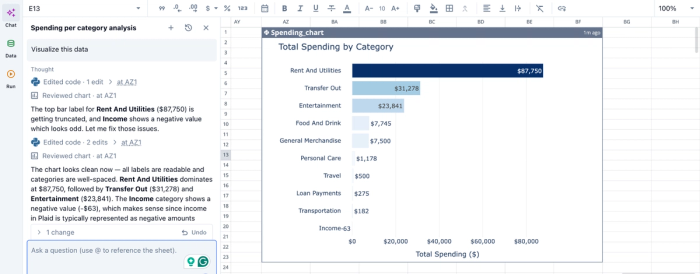
In the image above, I simply ask Quadratic to “Visualize this data”. In seconds, it creates a bar chart that shows the breakdown of total spending by category. Users do not need to specify the chart type, as Quadratic intelligently uses the most appropriate chart type based on your dataset.
Collaborate on household or team financial workflows
Personal finance is not always personal in the literal sense. Couples, families, founders, finance teams, and shared households often need collaborative visibility into budgets, expenses, and financial planning decisions.
Quadratic’s collaborative financial analytics platform allows multiple people to review spending dashboards, inspect transaction categorizations, validate assumptions, and contribute notes directly in the same spreadsheet environment.
A shared household budget can become a living collaborative document instead of a file emailed back and forth every month. A startup founder and finance lead can track operational expenses and runway projections together. A financial advisor could collaborate with a client directly inside a live planning sheet.
Start building your own AI personal finance dashboard
The arc is straightforward. Raw bank data flows in, AI categorizes and summarizes it, and you assemble a spending and net worth dashboard you actually own. The differentiators that make this approach last are the ones that closed apps can't offer. This includes live data without manual exports, transparent logic you can read and revise, and a dashboard that grows with your life instead of expiring with the next app you try.
Quadratic allows you to connect your bank accounts data directly to the grid and use AI to analyze your spending, cash flow, and net worth in a spreadsheet you control. Try Quadratic for free.
Frequently asked questions (FAQs)
What makes an AI-powered personal finance app different from a traditional budgeting app?
An AI-powered personal finance app automates categorization and anomaly detection, but most operate as black boxes where you can't see or modify the logic. A connected AI spreadsheet like Quadratic gives you the same automation while keeping every formula and rule visible and editable in cells, so you can audit how your spending is being categorized and adjust it when your life changes.
How does Quadratic solve the data-ingestion problem that kills most DIY finance workflows?
Most spreadsheet budgets fail because exporting CSVs from multiple banks each month becomes tedious and eventually stops happening. Quadratic's Plaid integration eliminates this step by syncing transactions and balances directly into your sheet automatically, so your spending dashboard always reflects current data without manual lifting.
How often should I update and review my spending dashboard?
Most people benefit from a weekly data refresh to keep cash flow current and a monthly review session to scan anomalies and check for category drift. Because your transactions sync automatically in Quadratic, the refresh happens without effort.