
James Amoo, Community Partner
May 19, 2026

Table of contents
- Building pipelines vs. generating insights
- Evaluating Polygon.io: developer experience and coverage
- Polygon.io vs Alpha Vantage and other alternatives
- An analysis-first alternative: unifying data in Quadratic
- Polygon.io vs. Quadratic for stock market analysis
- Conclusion: choosing the right stack for your financial data
- Frequently asked questions (FAQs)
The financial data API landscape is highly fragmented, making it difficult for developers and analysts to choose the right provider. When looking at Polygon.io vs other market data solutions, the decision hinges on your precise data requirements and your tolerance for integration complexity.
This article frames the choice not just as a comparison of platforms, but as a strategic decision between building an API-first pipeline or adopting an analysis-first workflow. This guide focuses strictly on analytical and research workflows, explicitly excluding low-latency trading architectures where execution speed is the only metric that matters.
Building pipelines vs. generating insights
The traditional API-first approach requires significant engineering overhead. Developers must build databases, manage scripts, and write boilerplate integration code just to get the data into a usable state. In contrast, an analysis-first approach minimizes this upfront financial API integration effort. It allows teams to focus strictly on data exploration, visualization, and extracting insights.
Understanding the data versus execution divide is critical here. Some platforms are built strictly for delivering market data, while others are designed to execute trades. The right choice depends on your team's goals. If you want to manage infrastructure and build custom software, a pure API pipeline makes sense. If your primary goal is financial data analytics, you need a solution that gets you to the insights faster.
Quadratic helps bridge this gap by combining live data connectivity, spreadsheet flexibility, Python-based computation, and AI-assisted analysis in a single workspace. Instead of spending weeks building custom ingestion layers and dashboard infrastructure, teams can pull market data directly into the grid, run complex financial models, and collaborate in real time.
Evaluating Polygon.io: developer experience and coverage
Polygon.io stands out for its primary strengths in broad asset coverage, historical data depth, and real-time capabilities. It provides a robust data analytics strategy for teams that need extensive market data across stocks, options, and forex. When evaluating Polygon.io vs traditional legacy providers, its developer experience is a major differentiator. The platform offers high-quality documentation and consistent JSON schemas that make parsing responses straightforward.
However, utilizing this data still requires substantial data integration effort. Developers must write logic to handle large data payloads and maintain stable WebSocket connections for real-time streams. This engineering work is a prerequisite before any actual financial analysis can begin.
Another major advantage of Polygon.io is its suitability for high-frequency and data-intensive workflows using Polygon stock data. The platform’s low-latency infrastructure and granular historical datasets make it especially appealing for quantitative research and data analysis. Teams building intraday strategies or event-driven analytics can benefit significantly from the depth and speed of the available market feeds, such as a stock market news API.
At the same time, the operational complexity increases as workflows scale. Managing large historical datasets, synchronizing streaming feeds, and storing market data efficiently can quickly become resource-intensive. For smaller teams or analyst-driven organizations, the challenge is building a reliable system that transforms raw API responses into structured workflows without creating a long-term infrastructure burden.
Polygon.io vs Alpha Vantage and other alternatives
When comparing Polygon.io vs Alpha Vantage alternatives, pricing structures and data access models are key differentiators. Some providers use tiered plans based on API calls, while others offer unlimited data models for a flat fee.
Another critical factor is the ease of Python integration when using a Python stock market API. The availability of official libraries and community support varies significantly across different providers. Your specific data needs should ultimately dictate your choice. Teams requiring tick-level data for granular backtesting will naturally gravitate toward different providers than those who only need daily summaries for stock portfolio tracking.
The hidden engineering costs of market data APIs
Managing standalone APIs introduces pipeline complexities that are often underestimated. Developers face several hidden engineering costs:
- Strict rate limiting that requires custom retry logic.
- Complex error handling to ensure data pipelines do not break during market hours.
- Difficulty standardizing data schemas when pulling fundamentals, news from a financial news API, and pricing from multiple distinct endpoints.
Writing custom data transformation code to map disparate JSON structures into a unified format takes time. Ultimately, this results in significant time lost to infrastructure maintenance and data scaling, detracting from actual financial analysis and strategy development.
Bridging market data with usable financial workflows
One of the biggest gaps in modern financial analysis is the disconnect between raw market data access and actual analytical productivity. APIs like Polygon.io, Alpha Vantage, and other providers are excellent at delivering financial data so you don't have to scrape stock data, but they stop at the infrastructure layer. Analysts still need to clean datasets and build dashboards before they can extract meaningful insights.
This is where workflow design becomes just as important as the quality of the underlying API. A technically powerful data provider loses value if teams spend most of their time maintaining scripts or rebuilding dashboards every time requirements change. Modern finance teams increasingly need environments that combine live market data access, transformation logic, visualization, and collaboration in a single workspace.
An analysis-first alternative: unifying data in Quadratic
Quadratic offers a strategic solution to bypass heavy API pipeline builds and hidden engineering costs. As an analysis-first alternative, it integrates stock market analysis directly into a familiar spreadsheet environment. Let’s explore the features of Quadratic:
Connect live market data without building infrastructure
One of the highest hidden costs in modern market analysis is the engineering overhead required to maintain reliable API pipelines. While platforms like Polygon.io provide powerful market data access, teams still need to handle authentication, refresh cycles, and downstream analysis logic separately. Quadratic eliminates much of this operational friction by bringing live market data directly into the spreadsheet environment.
Using native Python and built-in integrations, analysts can connect to stock market data APIs, databases, and financial data providers directly from the grid. Instead of spending weeks building middleware just to download historical stock data and access usable datasets, you can immediately start working with historical prices and macroeconomic indicators inside the same workspace.
Build advanced financial models with native Python
Quadratic combines spreadsheet automation with the flexibility of native Python and SQL execution. Analysts can run advanced quantitative workflows directly inside the browser without maintaining separate notebook environments or external infrastructure. This makes it easier to build custom factor models, Monte Carlo simulations, or portfolio optimization workflows alongside live market data.
Because the code executes directly in the same environment as the data and charts, every transformation remains transparent and auditable. Analysts can inspect assumptions and modify logic instantly without disrupting the broader workflow.
Automate recurring analysis and reporting workflows
Beyond ad hoc analysis, Quadratic supports continuously updating financial workflows. Teams can schedule tasks and Python scripts to automatically update dashboards and reports in the background. This transforms static spreadsheets into continuously running analytical systems that remain current as market conditions evolve.
For organizations comparing Polygon.io vs. broader market data workflows, this approach changes the conversation entirely. Instead of treating APIs as isolated data feeds that require extensive engineering before becoming useful, Quadratic turns live market data into immediately actionable research infrastructure within an integrated workspace.
Use AI to accelerate financial analysis and market research
Quadratic’s AI capabilities are designed to support practical financial workflows rather than generic automation. Analysts can ask an AI stock picker to compare valuation multiples across watchlists, identify abnormal volatility patterns, or generate ranking models based on custom investment criteria.
The AI layer also helps clean and structure financial datasets from a financial statements API. It can standardize inconsistent API outputs and assist with exploratory data analysis directly in the spreadsheet. This reduces the time required to transform raw market data into actionable investment intelligence.
Let’s see how this works using the stock market analysis template in Quadratic:
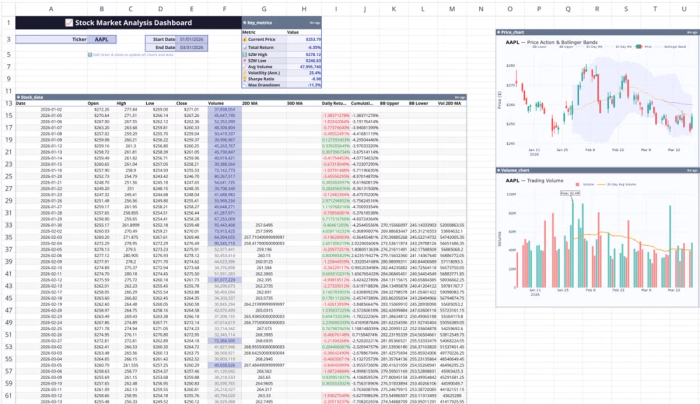
This template includes ready-made features for real-time stock data visualization, technical indicator calculations (RSI analysis), price trend analysis, and volume analysis. All you have to do is input the company’s ticker, and the data updates automatically. You can also perform advanced analysis on this data using simple text prompts:
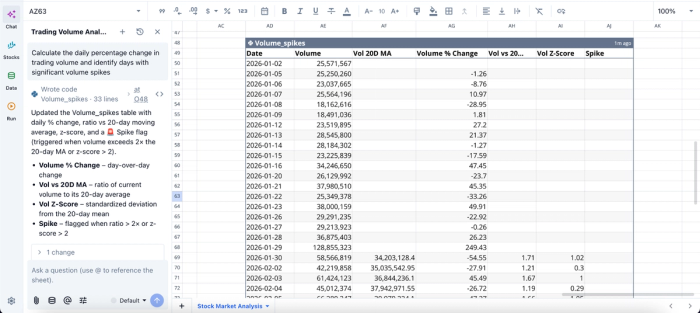
In this image, I ask Quadratic AI to “Calculate the daily percentage change in trading volume and identify days with significant volume spikes”. It instantly generates a table that gives a breakdown of volume spikes across the 30-day window, showing days where a spike occurs.
Visualize market behavior in real time
Financial analysis becomes significantly more powerful when financial data visualization is tightly integrated into the research process. Quadratic allows teams to generate dynamic charts and dashboards directly from live datasets without exporting information into external BI tools.
This integration between live market data, computational logic, and data analysis and visualization helps analysts identify anomalies faster and communicate insights more effectively. Instead of maintaining disconnected dashboards, the visualization layer becomes part of the analytical workflow itself.
Visualization in Quadratic can also be done by using text prompts:
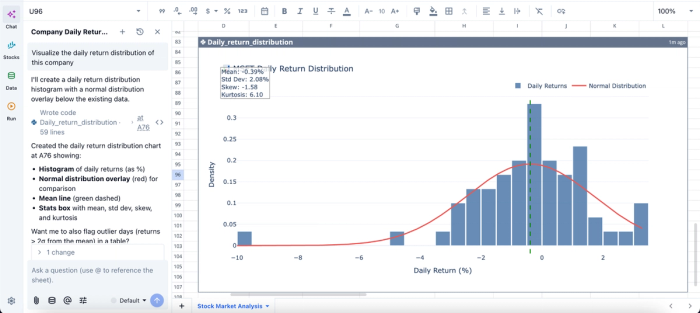
In this image, I ask Quadratic AI to “Visualize the daily return distribution of this company”. It creates a histogram of the daily returns alongside the normal distribution overlay. This helps analysts easily understand the insights generated from raw data.
Collaborate on financial models in a shared workspace
Market research is increasingly collaborative, especially across portfolio managers, analysts, and operations teams. Quadratic enables real-time multiplayer collaboration where multiple users can simultaneously review datasets and annotate findings inside the same workspace.
Since all data, logic, and outputs remain centralized, teams avoid the version-control issues that commonly emerge with exported spreadsheets or disconnected Python notebooks. This creates a collaborative analytics platform where research workflows stay synchronized and fully reproducible.
Polygon.io vs. Quadratic for stock market analysis
In this section, we’ll see how Polygon.io and Quadratic compare using various metrics, helping you choose the best workflow for stock market analysis.
| Metric | Polygon io | Quadratic |
|---|---|---|
| Integrated market data analysis | Primarily focused on delivering raw market data APIs that require external tooling for analysis | Combines live market data, Python, AI, formulas, and visualization in one collaborative workspace |
| Built-in stock market datasets | Strong API coverage for market data, but analysis environments must be built separately | Native access to historical prices, fundamentals, financial statements, and market analysis workflows. |
| AI-assisted stock research | No native AI analysis layer for interpreting or modeling stock market data | AI can summarize earnings, compare valuation metrics, and assist with portfolio analysis directly in the grid |
| Visualization and dashboard creation | Visualization requires third-party BI tools, notebooks, or frontend applications | Interactive charts, portfolio dashboards, and analytical visualizations are built directly on top of live market data in the same workspace |
| Collaboration | An API-centric workflow can create fragmented research environments across scripts and spreadsheets | Real-time multiplayer collaboration with centralized logic, code, charts, and datasets in one auditable workspace |
Conclusion: choosing the right stack for your financial data
Comparing Polygon.io vs other market data requires weighing your specific data cadence needs against your integration capacity. While code-heavy pipelines are necessary for certain high-frequency financial API use cases, analytical workflows benefit greatly from unified environments that reduce boilerplate code.
By shifting the focus from infrastructure to insights, analysts and developers can work more efficiently. Prototype your market data workflow in Quadratic and compare whether you need a standalone API pipeline or an integrated spreadsheet analysis layer. Try Quadratic for free.
Frequently asked questions (FAQs)
What is the main consideration when evaluating Polygon.io vs other market data providers?
The core decision revolves around whether to adopt an API-first approach, which requires significant engineering to build data pipelines, or an analysis-first workflow, which prioritizes generating insights. This choice depends on your team's goal to either manage infrastructure or focus directly on financial analysis.
What are Polygon.io's key strengths and typical integration challenges?
Polygon.io is valued for its broad asset coverage and robust real-time capabilities, coupled with a strong developer experience. However, leveraging this data still demands considerable integration effort for tasks like handling large data payloads and maintaining stable real-time connections.
How does Quadratic address the hidden engineering costs of market data APIs like Polygon.io vs Alpha Vantage?
Quadratic offers an analysis-first alternative that unifies market data directly within a familiar spreadsheet environment, using native Python and AI. This approach bypasses the need for complex API integrations and schema standardization, allowing teams to focus on analysis and strategy development instead of pipeline maintenance.