
James Amoo, Community Partner
May 7, 2026

When financial analysts and developers set out to build a new market data project, they usually start in the same place: comparing API endpoints. Evaluating Alpha Vantage vs Finnhub is a common first step, as both providers offer robust access to global market data. However, many teams quickly discover that the hardest part of stock market analysis is not actually fetching the data. The real bottleneck lies in the data transformation of raw nested JSON responses into clean tables.
This guide evaluates both APIs on their technical merits and data coverage. But rather than stopping at a traditional endpoint comparison, we will also explore an integrated workflow alternative that collapses the data pipeline entirely. By shifting the focus from how data is retrieved to how it is actually analyzed, you can choose a setup that minimizes engineering overhead and accelerates your time to insight.
The real challenge: API integration vs. time to insight
Teams often underestimate the friction involved in building and maintaining a standalone market data pipeline, including the broader financial API integration challenges. While it is tempting to choose a provider based purely on the sheer volume of data they offer, raw data volume matters far less than data quality, consistency, and decision-readiness.
When you compare Finnhub vs Alpha Vantage, the evaluation should center around practical workflow constraints. You have to account for data coverage and rate limits, but you also need to plan for post-retrieval engineering. Once the data hits your server, someone has to write the logic to parse it, clean it, handle missing values, and structure it for the end user. If your primary goal is to run financial reporting or build internal accounting dashboards, spending weeks managing API infrastructure delays your actual analysis.
Quadratic addresses this gap by collapsing the distance between data exploration and usable insight. Instead of building and maintaining separate data processing and transformation layers, you can pull live market data directly into a structured workspace and immediately apply analysis using Python, SQL, or formulas.
Alpha Vantage vs Finnhub: Core API comparison
To make an informed decision between Alpha Vantage and Finnhub, you need a structured framework based on real-world implementation. The right choice depends heavily on your specific financial use cases, whether you are building basic SQL charting applications, conducting academic research, or developing complex quantitative models.
The following criteria break down the core differences between these two popular market data providers.
Data coverage and asset classes
Both platforms provide extensive access to global markets, but their core strengths cater to slightly different needs.
Alpha Vantage has built a strong reputation around its traditional market data offerings. It is particularly well-regarded for its extensive historical price data, comprehensive forex and cryptocurrency coverage, and a wide array of built-in technical indicators. If your workflow relies heavily on historical backtesting or technical analysis, Alpha Vantage provides a solid foundation.
Finnhub, on the other hand, leans heavily into institutional-grade alternative data. Alongside standard stock pricing, Finnhub offers robust coverage of news sentiment, earnings call transcripts, and fundamental data. They also provide real-time websockets, making it a strong contender for applications that require live market monitoring or sentiment analysis driven by breaking news.
Rate limits, pagination, and technical constraints
Scaling API usage for broad market analysis introduces significant technical bottlenecks. How a provider handles rate limits and pagination directly impacts how you build your application.
Alpha Vantage utilizes a straightforward REST API structure, but its rate limits are strictly enforced depending on your subscription tier. Developers must carefully manage the frequency of their calls to avoid hitting caps, which often requires building architectural overhead like robust retry logic and throttling mechanisms.
Finnhub also enforces rate limits, but its inclusion of websocket connections for real-time data allows developers to stream updates without constantly polling REST endpoints. However, when pulling large historical datasets, you still have to navigate pagination structures and ensure your data pipeline can seamlessly stitch together multiple API responses without dropping records.
Pricing predictability
Evaluating pricing tiers is about understanding how costs scale with increased data demands. Both providers offer freemium models that are excellent for prototyping, but these free tiers come with strict limitations on API calls and data access. As you move into premium enterprise plans, you unlock higher rate limits, broader asset coverage, and dedicated SLAs.
However, the true cost of an API-first approach includes the hidden costs of developer time. The hours spent managing API constraints, updating integration scripts, and troubleshooting failed data pulls often outweigh the raw subscription fees.
Integration complexity and developer experience
Another key consideration is how easily each API integrates into your existing workflow. Alpha Vantage is known for its simplicity and beginner-friendly documentation, making it a strong entry point for individual developers or small teams. Its endpoints are relatively straightforward, which reduces the initial setup time but may require additional tooling for more advanced use cases.
Finnhub, while more powerful in terms of data breadth and real-time capabilities, introduces greater architectural complexity. Implementing websocket streams, handling asynchronous data flows, and managing larger datasets often require more advanced engineering expertise. For teams without dedicated data engineering resources, this added complexity can slow down development and increase maintenance overhead.
Workflow scalability
Beyond initial integration, it is critical to evaluate how well each solution scales with your workflow over time. As your models become more sophisticated, maintaining separate scripts for research and data analysis can lead to fragmented systems and increased technical debt.
This is where Quadratic offers a compelling alternative. Instead of managing multiple APIs and pipelines, Quadratic allows you to pull, analyze, and visualize financial data within a single environment. This reduces long-term maintenance overhead and enables teams to focus on analysis rather than infrastructure.
A workflow-first alternative: Integrated analysis with Quadratic
If your team is spending more time managing data pipelines than analyzing the market, it might be time to rethink the architecture. Quadratic offers a workflow-first alternative by collapsing data retrieval, structuring, and analysis into a single spreadsheet environment, making it one of the best data science tools for financial professionals. Let’s explore the features of Quadratic in detail:
Connect multiple financial data sources without pipeline overhead
Rather than being limited to a single provider, Quadratic enables direct connections to multiple APIs, databases, and stock market data simultaneously. This allows you to combine pricing data, fundamentals, macroeconomic indicators, and alternative datasets without building complex ETL infrastructure.
This capability allows analysts to normalize and align datasets immediately after ingestion. This reduces dependency on external preprocessing and ensures that your analysis always reflects the most current and comprehensive view of the market.
Move from API calls to a complete research workflow
Tools like Alpha Vantage and Finnhub are designed to deliver data efficiently, but they stop at the point of extraction. Quadratic shifts the focus from isolated API calls to a continuous analytical workflow where ingestion, transformation, and interpretation happen in one place. Instead of writing scripts to fetch data and then exporting results into separate tools, you operate within a unified environment where every step is directly connected.
This approach eliminates the operational overhead of maintaining pipelines across multiple systems. Your data retrieval logic, analytical models, and final outputs coexist in the same grid, allowing you to iterate faster and maintain full visibility over how insights are generated.
Unify technical, fundamental, and alternative analysis
A major limitation of single-API workflows is their narrow scope. Quadratic allows data blending of multiple analytical perspectives within the same model. You can combine technical indicators, financial statement API, and external signals into a single analysis without switching tools.
This supports more sophisticated strategies. Instead of relying on isolated metrics, you can construct multi-dimensional models that better reflect real-world market dynamics and investment considerations.
Execute custom financial models with native Python
Where traditional API workflows require external environments for computation, Quadratic embeds native Python and SQL directly into the spreadsheet interface. This allows you to move beyond basic data retrieval and implement advanced financial logic without leaving the workspace.
The key advantage is transparency. Every transformation is executed alongside the data it operates on, making it easy to audit assumptions and refine models. This removes the disconnect between raw data and analytical output that often exists in script-based workflows.
Accelerate analysis with AI-guided exploration
Quadratic’s AI capabilities fundamentally change how analysts interact with financial data. Instead of manually writing every query or transformation, you can prompt the system to analyze trends, compare companies, or evaluate performance across a dataset. For example, you can request a comparison of revenue growth, margins, and valuation multiples across a watchlist and receive structured outputs instantly.
This reduces the time spent on repetitive tasks and enables rapid hypothesis testing. Analysts can focus on interpreting results and refining strategies rather than managing low-level implementation details.
Let’s see how this works using Quadratic’s technical analysis template:
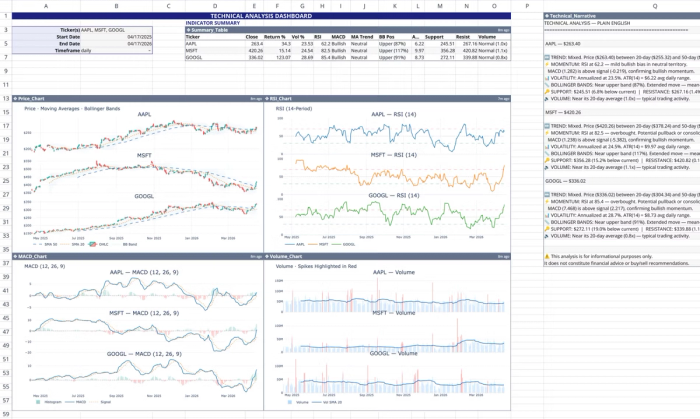
This template functions as a self-contained live market dashboard within Quadratic. It automatically pulls real-time and historical stock data using Quadratic's stock market data API to calculate and visualize 12 standard technical indicators. Users can also perform custom analysis by using text prompts:

In this image, I prompt Quadratic AI, “Using a table, analyze the trend and momentum for each stock using its respective technical indicators.” It instantly generates a table that shows the trend and momentum analysis for each stock,
Build dynamic visualizations tied directly to live data
In traditional API-driven workflows, visualization is often an afterthought handled in separate BI tools. Quadratic integrates financial data visualization directly into the analytical process, allowing you to create different chart types and dashboards that are natively linked to your live datasets and models.
Since these visualizations update automatically as new data flows in or logic changes, they provide an immediate feedback loop. This makes it easier to validate assumptions and communicate insights without exporting data to external platforms. Visualization in Quadratic can also be done by using text prompts. Here:
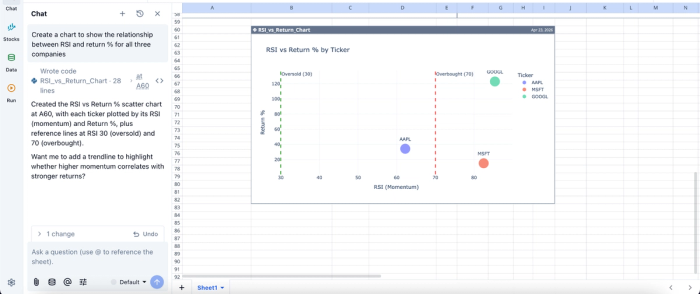
In this image, I ask Quadratic to “Create a chart to show the relationship between RSI and return % for all three companies.” In seconds, it creates a scatter chart that shows insights into RSI vs return based on live stock data.
Collaborate on live financial models without version conflicts
API-centric workflows often rely on individual scripts or isolated notebooks, making collaboration difficult. Quadratic addresses this by providing a collaborative analytics platform where teams can work on the same model simultaneously.
This shared workspace ensures that all stakeholders operate on the same version of the data and logic. Analysts can review each other’s work, validate assumptions, and iterate collectively, significantly improving both speed and accuracy.
Quadratic vs Alpha Vantage vs Finnhub
| Metric | Alpha Vantage | Finnhub | Quadratic |
|---|---|---|---|
| Built-in stock market data access | API-based; requires requests, parsing, and handling | API-based | Native, directly usable inside the grid with no external setup |
| Custom stock screener development | Must build externally using scripts or Excel integrations | Requires backend scripting or notebooks to implement | Native Python + formulas + AI in one workspace; fully auditable |
| Financial modeling flexibility | Limited to raw endpoints; modeling handled externally | Strong data coverage, but modeling must be built separately | Seamlessly combine technical indicators, fundamentals, and custom metrics in one model |
| AI-driven research workflows | Not supported natively | Not supported natively | Ask AI to generate, test, and refine stock hypotheses directly in the workspace |
| Visualization | Not supported natively; requires BI tools or spreadsheets | Not supported natively; requires external visualization tools | Built-in, dynamic, and tied directly to live data |
| Collaboration | No native collaboration; file/version fragmentation | No native collaboration; depends on external tooling | Real-time collaboration with transparent and reproducible workflows |
Next steps: Prototype your market data workflow
Before committing to a long-term architecture or upgrading to a premium data tier, the most effective approach is to validate your workflow with a real proof of concept. This means testing how each provider handles schema consistency and how easily the data integrates into your downstream analysis. A controlled prototype gives you a practical answer to the Alpha Vantage vs Finnhub decision, based on how each performs within your actual use case rather than theoretical feature comparisons.
Quadratic simplifies this evaluation by giving you a unified environment to run these experiments end-to-end. You can pull live stock market data directly into the grid and immediately test transformations using Python, SQL, or formulas without setting up external pipelines. Try Quadratic for free.
Frequently asked questions (FAQs)
What is the primary challenge when evaluating Alpha Vantage vs Finnhub for market data projects?
The main challenge extends beyond just comparing API endpoints to the significant effort required for post-retrieval data processing. Teams often struggle to transform raw JSON responses into clean, analysis-ready tables, which delays actual insights. This engineering overhead is a critical factor often underestimated in the Alpha Vantage vs Finnhub decision.
How do Finnhub vs Alpha Vantage compare regarding data offerings and technical limitations?
Alpha Vantage excels in traditional market data, historical prices, and technical indicators, while Finnhub specializes in institutional-grade alternative data and real-time websockets. Both enforce rate limits, but Finnhub's websockets offer a different approach to real-time data compared to Alpha Vantage's REST API, which requires careful call management.
How does Quadratic simplify market data analysis compared to an API-first approach?
Quadratic collapses the entire data pipeline into a single spreadsheet environment, eliminating the need to build and maintain standalone API integrations. Users can leverage AI-assisted Python to pull diverse datasets directly, which are instantly structured into analysis-ready tables. This integrated workflow accelerates time to insight by reducing engineering overhead and ensuring full auditability.