James Amoo, Community Partner
May 26, 2026

If you have spent any time using AI tools for data analysis, you know the routine. You copy a table out of a spreadsheet, paste it into ChatGPT, ask a question, get an answer, and then realize the data has already changed. Next session, you start over. Re-upload the CSV. Re-explain the schema. Re-establish the context. The work feels productive in the moment, but it never accumulates.
This is the gap that MCP for data analysis is designed to close, the same gap that has pushed the field toward AI spreadsheet analysis as a discipline in its own right. The Model Context Protocol turns AI from a one-off chat helper into a connected analysis client that can reach into your actual data surface and work there directly. Instead of pasting snapshots, you give the AI a live connection. Instead of single-turn answers, you get a session that reads, computes, and writes.
This article walks through a concrete data analysis MCP workflow: what it really is, why native data connection methods may not scale, and how to use MCP for data analysis within an intuitive spreadsheet.
What is MCP in plain terms?
The Model Context Protocol is an open standard for secure, two-way connections built on a client-host-server architecture that lets AI clients talk to external tools and data sources through a consistent interface. For analysts, the easiest way to think about it is this: MCP is a connector standard between an AI client (like ChatGPT, Claude, or VS Code) and a data or tool surface (like a spreadsheet, a database, or a code execution environment).
What matters for MCP data analysis work is the capability it unlocks. Once an AI client speaks MCP, it can call defined operations on the connected server. It stops guessing about your data and starts working with it directly.
Quadratic’s MCP for data science connects AI assistants directly to a live spreadsheet environment where the grid, formulas, Python, SQL, charts, and connected data sources all coexist in one workspace. Rather than copying data into a chatbot and losing the logic after the session ends, analysts can use its built-in AI or MCP-connected AI to read from live spreadsheets, run Python and SQL against real datasets, and iterate continuously against the same source of truth.
The problem with pasting data into chat
The problem with pasting data into chat becomes obvious the moment analysis moves beyond a one-off question. The limitations fundamentally shape what kinds of workflows are possible. The moment you paste a table into a chatbot, it becomes a stale snapshot disconnected from the live source.
If a colleague updates the spreadsheet minutes later, the AI is still reasoning against outdated numbers. The flow is also one-way. Whatever insights, formulas, or summaries the AI produces remain trapped inside the chat transcript, forcing you to manually copy results back into the spreadsheet, which is exactly where transcription errors and broken workflows begin to accumulate.
The scaling problems become even more obvious with larger or recurring workflows. Large tables quickly consume token and context limits, forcing users to trim datasets before analysis, which means the AI never sees the full picture. Reproducibility also breaks down completely. There is no clean mechanism to rerun the same workflow next week against refreshed data without rebuilding the conversation from scratch.
Collaboration becomes equally fragmented because insights live inside isolated chat histories rather than inside a shared analytical surface where teammates can inspect and extend the work. For basic data exploration, pasting data into chat may be sufficient. For workflows that need to be repeatable, auditable, collaborative, or continuously refreshed, this model collapses quickly.
What an MCP server for data analysis actually enables
A data analysis MCP server flips the traditional chat-based model entirely. Instead of shipping pieces of data to the AI through pasted tables and uploaded files, the AI gets a persistent connection to a live data surface. That changes the workflow from isolated question-and-answer exchanges into spreadsheet automation with the actual dataset. Read operations become dynamic rather than static. The AI can query the current state of the sheet on demand, which means if a colleague updates a value or changes a formula, it immediately sees the latest version instead of reasoning against an outdated snapshot.
The connection also enables direct write operations and executable analysis. Rather than returning outputs that disappear into a chat transcript, the AI can write formulas, summary tables, charts, cleaned datasets, and calculated outputs directly back into the same spreadsheet environment. Python and SQL data analytics become far more useful in this model because the code runs against connected live data, with the resulting tables and data transformations landing directly in the grid where users already work.
The practical effect is that MCP servers for data analysis turn an AI assistant into something much closer to a programmable analyst, answering the question: can ChatGPT create spreadsheets? You describe the task, the AI performs the work against the real dataset, and the outputs remain attached to the workflow itself rather than trapped inside conversation history.
Why the spreadsheet is a natural MCP environment
Most MCP discussions focus on connecting AI to file systems, databases, or APIs. Those are valid surfaces, but for analysts, the spreadsheet is in many ways the ideal MCP target.
A spreadsheet already combines three things that AI needs: structured data, computational logic (formulas), and visible outputs (charts, summary tables). It is a canvas where reads and writes are equally natural. Treating a spreadsheet as a static file to be parsed misses this.
Code-enabled spreadsheets push the fit further. When Python, SQL, and formulas can all live in the same grid, an AI client connected via MCP has every tool it needs in one place. It can pull data, transform it with code, and drop a chart next to it. The stakeholder who opens the file later sees the analysis where they expect it, not buried in a chat log.
This is what makes MCP server data exploration in a spreadsheet feel different. The exploration and the artifact are the same thing.
How Quadratic fits as an MCP server for data analysis
Quadratic MCP is built specifically for the spreadsheet-as-data-environment use case described throughout this piece. One OAuth connection lets an AI client read sheet data, run Python and SQL, write values back, and generate charts inside the same workspace. There is no CSV round-trip and no manual context injection between turns. Let’s explore the possibilities in detail.
Work across multiple live data sources without rebuilding context
Quadratic MCP is particularly useful in environments where data originates from many systems simultaneously. The spreadsheet can connect directly to databases, APIs, analytics platforms, and operational tools while exposing that unified workspace to AI clients through MCP.
An analyst might combine Stripe exports, Postgres queries, CRM metrics, marketing attribution data, and financial reporting tables into one connected model. From there, an AI assistant can perform cross-source analysis directly inside the spreadsheet environment instead of requiring manual joins across disconnected systems.
This reduces one of the highest hidden costs in modern analytics workflows: rebuilding context between tools. Quadratic AI operates against the same connected workspace the human analyst sees, so the analytical state remains shared and persistent across sessions.
Build repeatable analysis pipelines with Python, SQL, and formulas
Most MCP demos focus on simple retrieval tasks, but real data analysis requires transformation logic, calculations, and reusable workflows. Quadratic supports Python, SQL, and spreadsheet formulas natively in the same grid, allowing AI agents connected through MCP to choose the right computational layer for the task.
A lightweight calculation might become a formula directly in the sheet. A multi-table transformation can run through SQL database querying. A forecasting workflow or statistical model can execute in Python without leaving the spreadsheet environment. All three paradigms coexist in one workspace, so the resulting workflow remains readable and auditable instead of fragmented across notebooks and BI tools.
For teams building repeatable reporting systems, this matters operationally. An AI client connected through MCP can refresh a SQL query from a warehouse, run Python-based enrichment logic, and update downstream dashboard calculations automatically. The entire chain stays visible in the spreadsheet itself.
Turn AI conversations into reusable workflows
One of the biggest limitations of traditional chat-based spreadsheet analysis is that the reasoning disappears after the conversation ends. The prompts live in the chat window, while the spreadsheet remains disconnected from the logic that produced the output.
Quadratic changes this limitation by turning AI actions into spreadsheet-native artifacts. When an MCP-connected AI generates a transformation, chart, formula, or Python workflow, the output lands directly in the grid as editable logic. The spreadsheet becomes the persistent memory layer for the analysis.
That means a workflow built today can run again next quarter without rebuilding context from scratch. The same connected spreadsheet can continue evolving, with analysts refining formulas or modifying SQL queries inline rather than restarting the process from a blank prompt.
Let’s see an example using a finance dataset. First, I connect to my bank account using Quadratic’s Plaid integration:
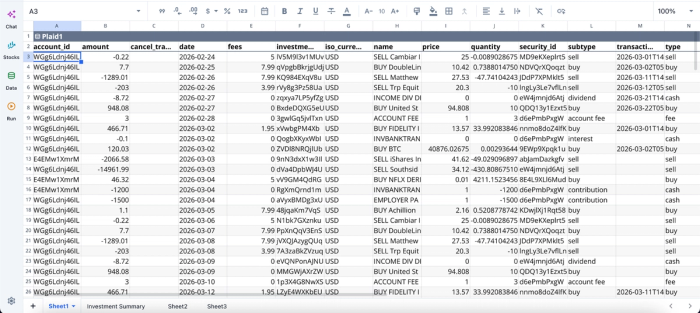
After successfully connecting to my data, I can immediately begin analysis:
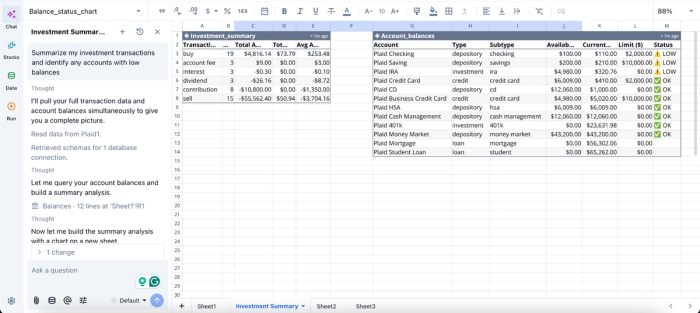
In this image, I ask Quadratic to “Summarize my investment transactions and identify any accounts with low balances.” It instantly creates two tables: one that shows a summary of my investment, and another that gives insights into my accounts with low balances.
Generate AI-powered visualizations from live data
Visualization workflows benefit significantly from the MCP model because the charts remain connected to the same live environment as the underlying data. Instead of exporting datasets into separate data visualization tools, an AI assistant connected through Quadratic can generate charts directly from the spreadsheet ranges or SQL query results already present in the workspace.
This allows teams to move from data processing to visual explanation in a single environment. An operations analyst might ask the AI to visualize cohort analysis, compare conversion rates across segments, or generate anomaly detection charts from recent API pulls. The charts remain editable and directly tied to the live data sources feeding the sheet.
Visualization in Quadratic can also be done using text prompts. Here’s an example:
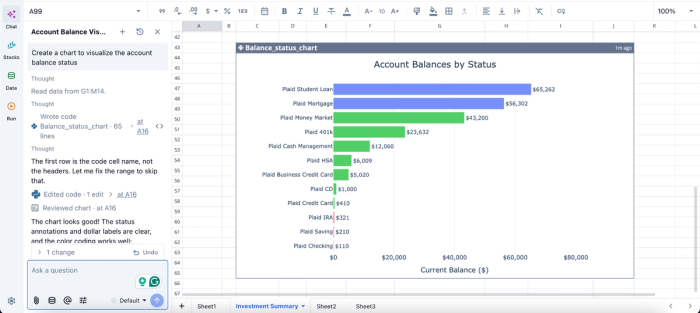
In this image, I ask Quadratic to “Create a chart to visualize the account balance status.” In seconds, it creates a chart that shows the account balance by status.
Support collaborative, multi-client AI workflows
Quadratic's MCP architecture also enables collaborative AI workflows across different clients and interfaces. Multiple tools, such as ChatGPT, Claude, Cursor, and VS Code, can connect to the same live collaborative analytics platform while operating against the same underlying data layer.
This creates a more flexible workflow model for technical and non-technical teams alike. A business analyst might use ChatGPT to generate summaries and charts, while an engineer uses Cursor to refine Python transformations against the same dataset. The spreadsheet becomes the shared operational surface where outputs converge.
Conclusion
The shift this article has been describing is simple to state. AI becomes far more useful for data analytics when it is connected to a live surface than when it is fed snapshots through a chat window. MCP for data analysis is what makes that connection practical, and the spreadsheet is the most natural surface to connect.
Stop pasting. Start connecting. Try Quadratic MCP for free as your MCP-backed data analysis workflow for spreadsheets, code, and AI in one system, and turn MCP for data analysis from a concept into something you actually use every day.
Frequently asked questions (FAQs)
Can I connect ChatGPT, Claude, and VS Code to the same data through MCP?
Yes. With a shared MCP server, such as a spreadsheet MCP, multiple AI clients can connect to the same data source. Each client uses the interface that fits the task while reading and writing against the same underlying sheet, which keeps results consistent across tools.
How does Quadratic work as an MCP server for data analysis?
Quadratic offers an official MCP server that lets you connect ChatGPT, Claude, Cursor, VS Code, and other MCP-compatible AI tools directly to your spreadsheets. Through this connection, the AI can read live sheet data, run Python and SQL against it, write results and formulas back into cells, and generate charts.
Is MCP secure for sensitive spreadsheet data?
It can be, when the server uses OAuth and scoped permissions. Access is tied to identity, limited to specific sheets or workspaces, and revocable without rotating other credentials. Sensitive data stays inside the controlled surface rather than ending up in chat transcripts. For regulated environments, look for platforms like Quadratic that add SOC 2, HIPAA, self-hosting, or zero-retention options.
