James Amoo, Community Partner
Mar 30, 2026

Table of contents
- Step 1: Start with the business decision
- Step 2: Define owner-level metrics by function
- Step 3: Transition from siloed tools to a lean data stack
- Step 4: Build a repeatable decision-making cadence
- Step 5: Continuously refine your analytics strategy
- How Quadratic unifies your SMB analytics workflow
- Conclusion
- Frequently asked questions (FAQs)
Business owners today collect information from everywhere but still struggle to find clear answers. This is the core problem with modern SMB analytics. Driven by the idea that more information is always better, companies gather massive amounts of raw numbers without clear business goals. Instead of gaining clarity, teams suffer from dashboard bloat and analysis paralysis.
A lean strategy fixes this problem. It prioritizes actionable insights over vanity visualizations. For non-technical leaders, trying to establish a foundational strategy for SMB data analytics can feel overwhelming. The solution is to step back from the different charts and focus entirely on the specific metrics that drive your business forward.
This guide breaks the data exploration process down into five practical steps. Each step is designed to help you cut through the noise, align your data with your business goals, and build a data analytics strategy that actually supports better decision-making.
Step 1: Start with the business decision
The biggest mistake in SMB data analysis is looking at your raw data first. When you start by asking what data you have available, you inevitably build massive reports that nobody actually uses. Instead, you need to reverse-engineer your strategy.
Start with a simple question: What are the most important decisions we need to make this week? This financial reporting strategy creates focus and ensures that every data point you pull has a clear purpose.
When analytics is driven by decisions, it naturally becomes lean. Each metric exists to answer a specific question tied to a business outcome, whether that’s improving cash flow, optimizing full-funnel marketing, or streamlining business data analysis. This approach also reduces noise, making it easier for stakeholders to interpret and act on insights quickly.
For example, if cash flow is tight, the relevant question is not “what does our revenue look like?” but “which invoices are overdue and what is the total outstanding balance?” Similarly, if marketing performance is unclear, the focus shifts to funnel analysis and identifying which channels are generating qualified leads, not just traffic volume. By anchoring your analysis in decisions, you ensure your data strategy remains practical, targeted, and actionable.
Step 2: Define owner-level metrics by function
Once you know the questions you need to answer, you must select the right metrics. Avoid the temptation to track every possible data point. You only need a few owner-level metrics for each core business function.
These metrics should be organized by function to maintain clarity and accountability across the organization. Finance metrics like operating cash flow, gross profit margin, and runway provide insight into financial stability. Sales and marketing metrics such as customer acquisition cost, conversion tracking, and qualified leads help evaluate growth efficiency. Operational metrics like fulfillment time and resource utilization ensure the business is running efficiently, while product management metrics such as feature adoption and cohort analysis reflect product strength and sustainability.
The key is not perfection, but relevance. Especially in the early stages, it is far more valuable to work with good enough data that supports decision-making than to delay progress in pursuit of perfect data pipelines. Over time, these metrics should serve one purpose: giving business owners a high-level understanding of performance across core functions.
Step 3: Transition from siloed tools to a lean data stack
Answering a single business question often requires logging into three different systems. You might check your CRM for sales figures, your accounting software for revenue, and your platforms like Mixpanel or Google Analytics for traffic. This process wastes time and creates errors.
To build a lean stack, you need to unify these siloed tools into a central, flexible workspace. When evaluating software, especially SMB financial analytics platforms, prioritize integration speed. The right financial reconciliation tools should quickly connect your accounting data with your operational metrics. This allows your team to answer cross-functional questions instantly, rather than spending hours manually exporting and analyzing CSV files.
When your data stack is unified, cross-functional questions become much easier to answer. For example, you can directly link marketing spend to actual revenue outcomes or connect operational efficiency metrics to profitability. This eliminates the need for repetitive manual exports and significantly reduces the time spent preparing data.
Step 4: Build a repeatable decision-making cadence
Even the best metrics are useless if they are not reviewed and acted upon consistently. One of the biggest gaps in SMB analytics is the lack of a structured decision-making rhythm. Reports are generated, but they are not tied to a regular process that drives action.
To unlock real value, you need to establish a simple, repeatable cadence for reviewing your data. A weekly review cycle is often the most effective starting point. By setting aside a fixed time, you ensure that key stakeholders come together to assess performance and align on priorities for the week ahead.
This regular cadence ensures that your data directly influences the week's strategic actions.
Step 5: Continuously refine your analytics strategy
A lean analytics strategy is not something you build once and leave unchanged. It is an evolving system that should be continuously refined as your business grows. As priorities shift and new data becomes available, your metrics and workflows should adapt accordingly.
One of the most important practices is regularly auditing your dashboards and reports. Over time, it is easy for new metrics to accumulate, leading to the same dashboard bloat you initially set out to avoid. Periodically reviewing your analytics setup allows you to remove metrics that no longer serve a clear purpose and double down on those that drive meaningful decisions.
It is also important to evaluate whether your current metrics are still aligned with your business goals. As your company scales, the questions you need to answer will change. Early-stage businesses may focus heavily on cash flow and tax preparation, while more mature organizations might prioritize profitability and long-term planning.
Feedback loops play a critical role here. Pay attention to product adoption analytics and how your team interacts with data. This insight can guide improvements in how data is structured, presented, and used.
How Quadratic unifies your SMB analytics workflow
A lean analytics strategy only works if your tools support speed and flexibility. Many SMBs struggle not because they lack data, but because their data is scattered across disconnected systems. Quadratic addresses this by acting as a unifying layer across your entire data stack, transforming siloed information into a single and dynamic workflow built for real-time analysis and action.
Instead of forcing you to adapt your processes to rigid software, Quadratic provides a flexible environment where your data and insights live together. Let’s explore this in detail:
Direct connections to multiple sources
At the core of any effective analytics workflow is access to up-to-date data. Quadratic enables direct connections to multiple sources, including databases, APIs, and raw data files, eliminating the need for manual exports and fragmented spreadsheets.
For SMBs using multiple tools to run their operations, this capability is important. It creates a centralized data layer where financial, operational, and customer data analysis can be combined, enabling cross-functional insights that would otherwise be difficult to achieve.
AI data analysis
Quadratic integrates AI directly into the analytics workflow, making it easier to extract insights without relying on complex formulas or technical expertise. Users can conduct advanced financial data analytics using natural language, asking questions like “What caused the drop in revenue this week?” or “Which customers are contributing the most to profit?”
Using AI tools for data analysis significantly reduces the time required to analyze data and enables faster, more informed decision-making. AI can also identify trends, detect anomalies, and highlight key drivers of performance automatically, ensuring that important insights are surfaced without manual effort.
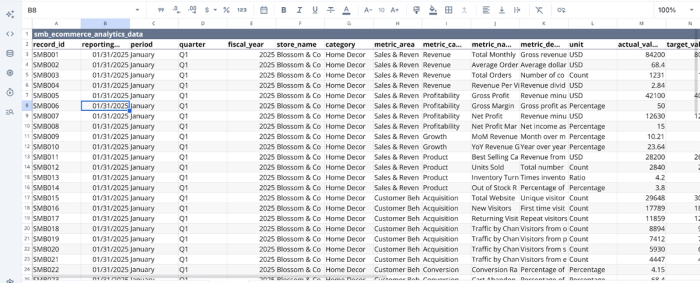
Let’s see how this works. First, I import my data into Quadratic:
Next, we dive into analysis. Suppose I want to get insights into the revenue trend:
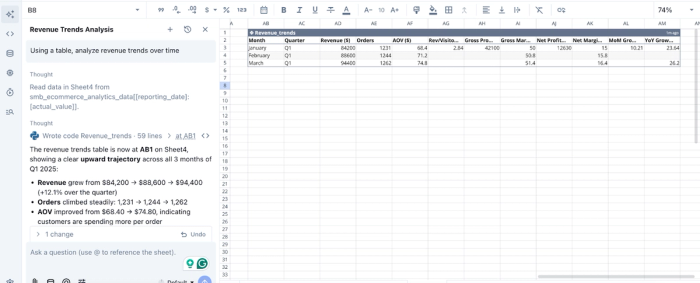
In this image, I prompt Quadratic, “Using a table, analyze revenue trends over time”. It creates a table showing insights into revenue, gross profit, gross margin, and other relevant finance metrics.
AI data visualization
Clear communication is essential for effective decision-making. Quadratic simplifies this by enabling AI-driven finance data visualization, allowing users to instantly generate charts and dashboards from live data.
These visualizations are not static; they update automatically as new data flows in, ensuring that your dashboards always reflect the current state of the business. Whether you are tracking cash flow, sales performance, or operational efficiency, you can quickly create views that are easy to understand and immediately actionable.
This eliminates the need for manual chart building and ensures that insights are always presented in a clear, consistent format.
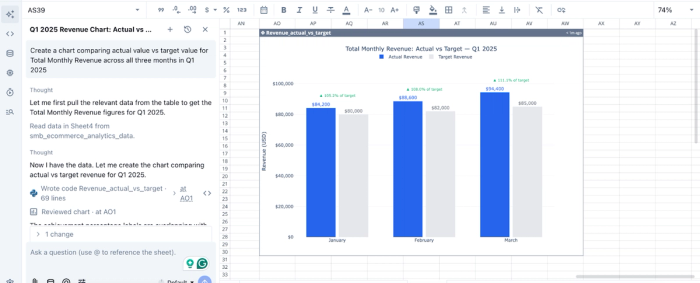
Here’s how you can create interactive visualizations in Quadratic:
In this image, I ask Quadratic to “Create a chart comparing actual value vs target value for Total Monthly Revenue across all three months in Q1 2025.” It instantly creates a bar chart, showing that Blossom & Co store exceeded targets every month in Q1, with performance accelerating from 105.2% in January to 111.1% in March.
Native support for programming languages
While simplicity is important, flexibility is equally critical. Quadratic supports programming languages like Python and SQL directly within its environment, allowing for more advanced data manipulation and modeling when needed.
This means you can go beyond basic analysis and build custom logic tailored to your business, whether that involves forecasting, segmentation, or combining multiple datasets in unique ways. Importantly, this happens within the same workspace, so you don’t have to move data between different tools to perform deeper analysis.
Collaboration
Analytics becomes significantly more valuable when it is shared and discussed across the organization. Quadratic provides a collaborative analytics platform that allows multiple users to work within the same environment, accessing and analyzing the same data simultaneously.
Teams can align on insights, validate assumptions, and make decisions together, all within a single platform.
Conclusion
Building an effective SMB analytics is not about creating the most complex charts. It is about shifting away from generic, overwhelming dashboards and focusing on a lean, decision-first approach. By defining owner-level metrics and establishing a weekly review cadence, you turn raw numbers into clear business direction.
The first step is bringing your disconnected data streams together. Connect QuickBooks, Mixpanel, Google Analytics, and your other systems to Quadratic and build the best KPI dashboards for your weekly review. Try Quadratic for free.
Frequently asked questions (FAQs)
Why do many SMBs struggle with data analytics?
Many small to medium-sized businesses (SMBs) collect vast amounts of information but often lack clear business goals, leading to dashboard bloat and analysis paralysis. This makes effective smb data analysis difficult, as teams get overwhelmed by raw numbers instead of gaining actionable insights.
What is a lean strategy for SMB data analytics?
A lean strategy for smb data analytics focuses on prioritizing actionable insights over complex visualizations. It involves starting with specific business decisions, defining owner-level metrics, and unifying siloed data tools to create a streamlined workflow.
How does Quadratic support a lean SMB analytics workflow?
Quadratic unifies disparate data sources like QuickBooks and Google Analytics into a single browser-based canvas, acting as a central hub for smb financial analytics and operational data. It allows teams to build dynamic reports using native SQL, Python, and formulas—eliminating the need for workarounds like SQL in Excel—or leverage AI capabilities to explore, clean, and summarize data for faster insights and robust portfolio reporting smb analytics.
What is the importance of a repeatable decision-making cadence for SMBs?
Establishing a repeatable decision-making cadence ensures that smb analytics directly drives action on a regular schedule. This routine moves teams from static dashboards to dynamic, owner-ready reports, fostering continuous improvement and strategic adaptation.