
James Amoo, Community Partner
May 7, 2026

Financial APIs are the critical infrastructure powering automated financial data analytics, much like the OCR financial statements API, which automates data extraction from documents. For analysts and product teams, simply having access to finance APIs is not enough. The real value is unlocked when teams meticulously match specific financial API use cases to the correct data shape and refresh cadence, turning raw endpoints into repeatable workflows for tasks like maintaining an accounting dashboard.
Broadly, these APIs serve two main functions. Transactional functions handle operational security, such as account verification and payments. Analytical functions power quantitative research, benchmarking, and valuation modeling. Moving beyond conceptual API definitions, this guide focuses on practical implementation for analysts and finance operations teams who need to build trustworthy financial reporting workflows, such as a robust spreadsheet for taxes.
Designing financial APIs for trust and scale
Trustworthy financial operations rely on adopting the financial API integration best practices. If your data integration techniques lack accuracy or completeness, the resulting analysis is effectively unreliable. A critical first step is ensuring proper data shape. Without this data transformation layer, even high-quality data becomes difficult to work with and prone to misinterpretation.
Aligning your data refresh cadence with the use case for the finance-related API is also important. Not every workflow needs real-time data, and over-fetching can introduce unnecessary system complexity. For example, a high-frequency trading model may require near real-time streaming updates, while a portfolio performance dashboard may only need consistent end-of-day data. Designing the right cadence ensures that your models are both efficient and contextually relevant.
Finally, robust validation checks are essential to maintaining trust in your workflows. APIs can fail, return incomplete payloads, or introduce silent errors that propagate through your models if left unchecked. By implementing automated validation, you can catch issues early before they impact downstream analysis. This layer of quality control is what separates fragile pipelines from production-grade financial systems.
Essential financial API use cases for analysts and ops
Knowing what is possible is the first step toward automation. Here is a practical guide to the most impactful financial API use cases teams can build using modern data endpoints.
Automated portfolio monitoring and reporting
For many teams, portfolio monitoring still relies on manually exporting and analyzing CSV files from brokerage accounts or custodians. Financial APIs replace this tedious process by feeding real-time or end-of-day positions directly into monitoring dashboards. This creates a single source of truth for portfolio health, ensuring analysts and stakeholders are always looking at the most current data without waiting for manual updates.
Investment screening and benchmarking
Fundamental data APIs allow analysts to programmatically filter investment opportunities against market peers based on specific financial metrics. Instead of manually updating spreadsheets with quarterly earnings data, teams can build screens that automatically pull the latest fundamentals. The primary efficiency gain comes from the ability to update screening criteria and run comparisons instantly, ensuring no opportunities are missed due to stale data.
Real-time valuation modeling
Standardized valuation models require a constant feed of accurate inputs to remain useful. By connecting live market data and historical prices directly into these models via APIs, finance teams can drastically reduce operational complexity. This automated flow of pricing data speeds up the time-to-market for investment decisions, allowing analysts to focus on interpreting the outputs rather than sourcing the inputs.
Fraud reduction and transaction verification
While analytical workflows dominate research, transactional APIs play a vital role in operational security and compliance. These endpoints allow platforms to automatically verify account details, check balances, and authenticate identities before executing financial operations. Integrating these checks directly into operational workflows significantly reduces fraud risk and ensures compliance with financial regulations.
Economic indicator tracking
Broader business data analysis and treasury operations rely heavily on macroeconomic trends. APIs that deliver economic indicators, such as interest rates, inflation metrics, or employment data, allow teams to track the macro environment programmatically. The true value emerges when analysts cross-reference this external market data with internal financial metrics to stress-test forecasts and adjust treasury strategies proactively.
Common integration patterns for finance teams
Moving data from an API endpoint to an analyst's desk does not always require heavy production infrastructure. While rigid ETL pipelines and enterprise data warehouses are necessary for massive data storage, they often move too slowly for front-line analytical workflows.
Finance teams benefit from integration patterns that prioritize operational flexibility and speed. Instead of waiting weeks for data engineering to build a pipeline, analysts need agile ways to call APIs directly into their workspaces. This lightweight approach is especially valuable for cross-system integration, such as blending data from a financial API with internal revenue metrics from a CRM or BI tools. By connecting these sources at the analysis layer, teams can rapidly build comprehensive models, including predictive analytics models that adapt as business needs change.
A growing best practice is the adoption of hybrid workflows that combine lightweight API access with analysis-ready environments. Instead of separating data exploration, transformation, and visualization across multiple tools, modern teams are consolidating these steps into unified workspaces. Quadratic enables this by allowing analysts to pull financial data, analyze it using AI, and build visual models in one place.
Unifying financial API workflows with Quadratic
Traditional spreadsheets struggle with the best finance API connections and nested data, forcing teams to rely on manual copy-pasting or disjointed scripts, making spreadsheet automation a critical need. Quadratic is an AI spreadsheet designed to solve this exact problem by combining data retrieval, AI-driven analysis, and visualization. Let’s explore the features of Quadratic in detail.
Connect financial APIs directly to operational models
One of the biggest challenges in financial API workflows is the disconnect between raw data extraction and business-facing analysis. Teams often pull data into scripts, transform it elsewhere, and only then surface it in reports. Quadratic removes this fragmentation by allowing you to connect directly to financial APIs, databases, and stock market data within a single workspace.
This means transaction data, market feeds, billing records, or financial statements can flow directly into your operational models without intermediate steps. Instead of managing multiple tools, your ingestion layer becomes tightly integrated with your analysis.
Build reliable transformation pipelines inside the grid
After ingestion, the real work begins: cleaning, structuring, and standardizing raw API payloads. Financial data often arrives in nested or inconsistent formats, requiring careful transformation before it can support decision-making. Quadratic enables you to perform these transformations directly in the same environment where the data lands.
Using a combination of spreadsheet formulas, Python, and SQL for data analysis, you can flatten JSON responses and construct reusable transformation layers. This approach mirrors modern ELT practices while keeping the entire workflow visible and auditable.
Extend API workflows with programmable logic
Common use cases for embedded finance APIs require more than basic transformations. Calculating cohort metrics, forecasting cash flow, or modeling financial scenarios often demands custom logic. Quadratic’s native support for Python and SQL allows you to implement this logic directly alongside your data.
This eliminates the need to move datasets into external environments for advanced analysis. Your code, inputs, and outputs remain in one place, ensuring that even complex workflows stay transparent and easy to maintain.
Use AI to accelerate reconciliation and anomaly detection
Operational finance workflows frequently involve reconciling datasets across systems and identifying discrepancies. Quadratic’s AI capabilities allow you to analyze your data directly, helping you detect anomalies, explain variances, and validate outputs without writing extensive diagnostic queries.
You can ask the system to compare transaction logs across sources, highlight mismatches, or summarize unusual patterns in large datasets. This significantly reduces the time spent on manual validation while improving the reliability of your reporting. Let’s see how this works.
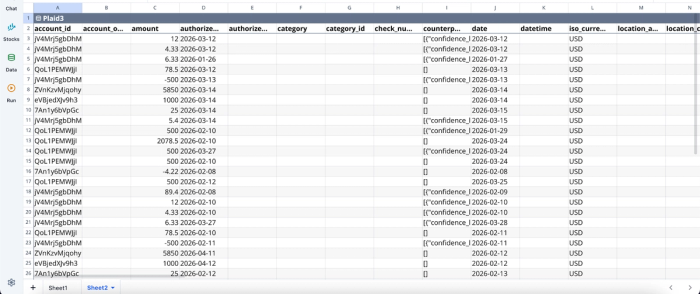
First, I connect to my financial dataset (bank account) via Quadratic’s Plaid integration:
After successfully connecting to my bank account, I can immediately begin analysis:
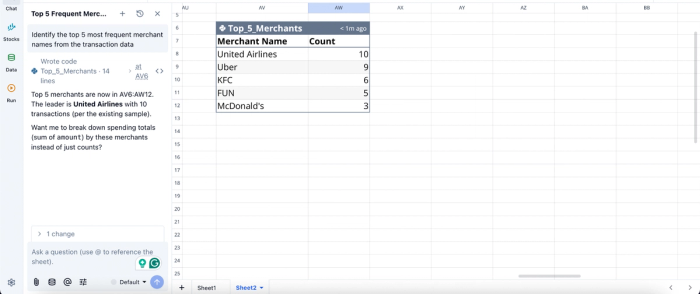
In this image, I ask Quadratic to “Identify the top 5 most frequent merchant names from the transaction data.” It instantly scans through the dataset and creates a table that shows the top 5 merchants based on my bank account information.
Turn API outputs into live operational dashboards
Raw API data only becomes valuable when it is translated into actionable insights. Quadratic integrates financial data visualization directly into the workflow, allowing you to build dashboards that reflect live API inputs.
Whether you are tracking cash flow, monitoring revenue performance, or analyzing operational KPIs, your dashboards update automatically as new data is ingested. This creates a real-time decision layer where stakeholders can act on current information without waiting for manual report generation. Visualization in Quadratic can also be done using text prompts:
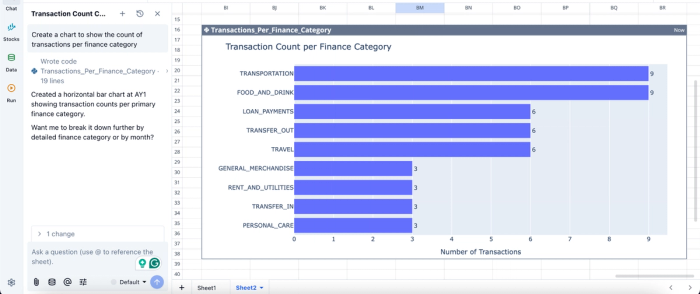
In this image, I ask Quadratic AI to “Create a chart to show the count of transactions per finance category.” In seconds, it creates a chart that displays the transaction count per finance category, providing visual insights into my spending patterns.
Collaborate across finance and data teams in real time
API-driven workflows typically involve multiple stakeholders, from data engineers to finance operators. Quadratic’s real-time collaboration enables these teams to work together within the same environment, reviewing transformations, validating outputs, and refining logic collectively.
This collaborative analytics platform reduces communication gaps and ensures that business context is embedded directly into the data workflow. Instead of passing reports back and forth, teams can iterate on the same live model.
Start building your financial API workflows
Moving from manual tasks to automated financial reporting requires a thoughtful approach to data integration. By mastering data shape and implementing strong validation checks, finance and ops teams can ensure their automated workflows are entirely trustworthy.
Pairing these best practices with an analytical workspace that handles both the data retrieval and the final reporting eliminates the traditional friction of the last mile. When you are ready to put these concepts into practice and explore new financial API use cases, the best approach is to start small and scale up.
Quadratic consolidates everything into a single environment. You can pull live financial data directly into the grid, apply transformation logic using Python, SQL, or formulas, and validate outputs in real time without leaving the workspace. Try Quadratic for free.
Frequently asked questions (FAQs)
What are some common financial API use cases for analysts and ops teams?
Analysts and ops teams frequently build financial API use cases for automated portfolio monitoring and reporting, investment screening, and real-time valuation modeling. Other key applications include fraud reduction, transaction verification, and tracking economic indicators for business forecasting.
How does Quadratic help finance teams implement financial API workflows more effectively?
Quadratic provides a unified AI spreadsheet workspace where analysts can connect directly to financial APIs and databases without leaving the grid. It helps solve the "last mile" problem by allowing users to pull, clean, and analyze complex API data using native Python, SQL, and formulas, enabling repeatable and automated reporting workflows.
Why is data quality important when developing financial API use cases?
Data quality is paramount for trustworthy financial API use cases because inaccurate, inconsistent, or stale data renders any resulting analysis useless. Meticulously matching data shape, aligning refresh cadence, and implementing validation checks are crucial to prevent errors from cascading into financial models and disrupting reporting.