James Amoo, Community Partner
Apr 20, 2026

Scaling a hospitality portfolio often exposes a painful reality: the manual and siloed reporting processes that worked for three locations completely break down when managing thirty. Operators and revenue managers quickly find themselves drowning in a sea of stale data, trying to manually stitch together property management metrics with financial data analytics.
To break out of this cycle, the right data stack must do more than just database analytics. It needs to unify operational and financial data to support a reliable and weekly operational rhythm.
If you are evaluating how to upgrade your data analytics infrastructure, this guide provides a strategic evaluation framework rather than a generic software listicle. We will explore the architectural requirements and workflows you need to consider when selecting the best analytics tools for hospitality tech.
Why analytics in hospitality industry breaks down at scale
When transitioning from a few locations to a larger portfolio, operators hit a critical data maturity wall. Managing multi-location data manually through static spreadsheets like Excel and Google Sheets becomes an impossible task, leading to version control issues and exhausted analysts.
The core friction usually lies between disconnected systems. Property management systems track daily operational metrics like occupancy, average daily rate, and revPAR. Meanwhile, financial accounting dashboards track the actual cash flow and vendor payments. Since these systems rarely speak the same language, teams are forced into a painful monthly financial reporting process.
Depending on the delayed monthly reporting costs operators revenue. By the time a performance drop at a specific property is identified in a month-end financial review, weeks have passed. Shifting from a sluggish monthly lookback to actionable daily or weekly data analytics in hospitality industry is critical for catching operational leaks and capitalizing on pricing opportunities in real time.
Core evaluation criteria for hospitality analytics
Finding the best analytics tools for hospitality industry means looking past flashy dashboard templates and focusing on capabilities that solve the specific pain points of multi-location data maturity. Operators should evaluate their data stack against three primary criteria.
Multi-entity reporting and rollups
Multi-entity reporting and rollups are essential as your portfolio grows. A strong platform should blend data across multiple properties, legal entities, and regions into a single view. At the same time, it must allow users to drill down from high-level portfolio metrics into individual location performance to investigate anomalies or underperformance. Flexibility is equally important. When new properties are added, the system should incorporate them seamlessly without requiring a complete overhaul of the reporting structure.
Deep integration with fragmented systems
Deep data integration with fragmented systems is another critical requirement. Relying on manual data exploration or CSV exports quickly becomes unsustainable at scale. Instead, the platform should support direct connections to operational systems and financial tools. This ensures that all teams are working with reliable data.
Standardized KPIs and cohort analysis
Finally, standardized KPI tracking combined with flexible analysis capabilities enable meaningful comparisons and deeper insights. The platform should enforce consistent definitions for key product management metrics across all locations.
At the same time, it should support cohort analysis, enabling operators to group properties by factors such as region, size, or maturity to uncover trends that may not be visible at the aggregate level. Custom metric definitions are equally important, ensuring the system can adapt to the unique operational model of each hospitality analytics platform.
The architecture of scalable hospitality data analytics
Historically, hospitality groups outgrowing budget apps or spreadsheets have turned to traditional business intelligence software. However, rigid BI tools often require significant engineering overhead and specialized developers just to change a simple metric definition.
Modern hospitality analytics software is shifting toward more flexible data architectures. Live-data spreadsheet automation environments offer a powerful alternative, blending the familiar grid interface with the power of modern data connections.
These environments provide the flexibility to build custom multi-entity rollups without the heavy implementation costs of enterprise BI. Operators can design custom architectures tailored precisely to their operational models, allowing analysts and finance teams to own the data workflow without constantly waiting on IT tickets.
How Quadratic streamlines hospitality analytics
Hospitality analytics is uniquely complex, requiring the integration of bookings, revenue, operations, and customer experience data across multiple systems. Most tools handle one slice well but fail to unify the full picture. Quadratic provides a flexible environment where hospitality operators can consolidate these inputs and build a cohesive analytics workflow.
Direct connections to multiple hospitality data sources
Quadratic connects directly to multiple databases, APIs, and financial tools like QuickBooks. This allows teams to pull both operational and financial data into a single workspace without manual consolidation.
With all systems integrated, operators can track occupancy and operating costs side by side. This is critical for making data-driven decisions across properties or service lines.
AI-powered data analysis
Quadratic uses AI agents for data analysis to analyze complex hospitality datasets, identifying trends in occupancy and cost efficiency. It can surface insights such as underperforming time periods or inefficiencies in staffing levels.
By automating these analyses, teams can focus on optimizing data analytics strategy rather than manual number crunching. AI-driven insights help operators quickly identify opportunities to improve margins and guest experience. Let’s see how this works.
First, I import my data into Quadratic:
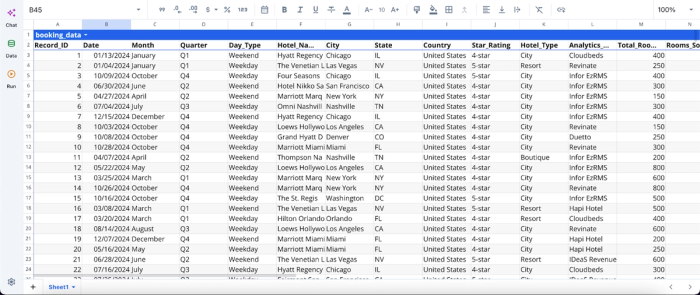
After successfully importing your data into Quadratic, you can immediately begin to analyze by simply asking questions. Here:
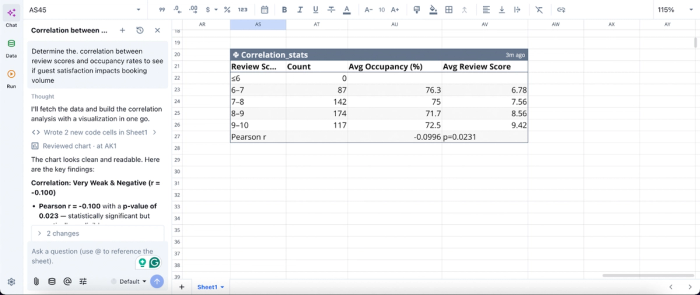
In this image, I ask Quadratic AI, “Determine the. correlation between review scores and occupancy rates to see if guest satisfaction impacts booking volume.” It generates a correlation statistics table that shows the correlation between average occupancy and review score. From this analysis, we can see that there’s a weak correlation between both metrics.
AI data visualization
Quadratic enables teams to build dashboards that visualize key hospitality metrics, including booking trends, revenue streams, and operational KPIs. These dashboards update automatically as new data is ingested.
Clear visualizations allow stakeholders to monitor performance in real time. This supports faster responses to changes in demand or operational challenges. Here’s how you can generate interactive visualizations in Quadratic using text prompts:
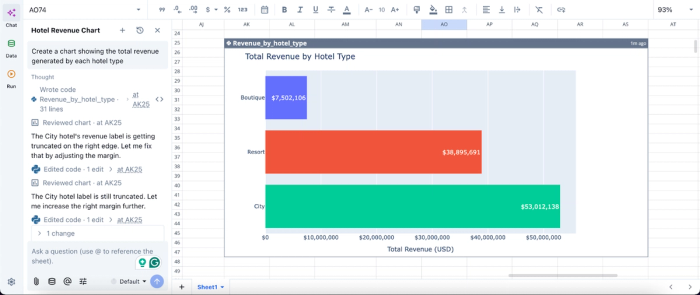
In this image, I ask Quadratic AI, “Create a chart showing the total revenue generated by each hotel type.” In seconds, it generates a line chart that shows the total revenue for each hotel type.
Multi-property and multi-channel analysis
Quadratic enables operators to analyze performance across multiple properties or channels within a single model. This includes comparing occupancy rates, revenue metrics, and operational costs.
By consolidating these comparisons, teams can identify high-performing assets and replicate successful strategies across the portfolio.
Automated reporting and background execution
Quadratic allows teams to schedule data refreshes and automate reporting workflows. This ensures that dashboards and analyses are always up to date without manual intervention.
Automation supports a consistent operational rhythm, such as weekly performance reviews or daily revenue tracking. Teams can rely on current data at all times.
Real-time collaboration across departments
Quadratic supports collaboration between finance and management teams within a single collaborative analytics platform. Everyone works on the same data and logic, eliminating version control issues.
This ensures that insights are consistent across departments. It also accelerates decision-making by enabling teams to investigate and resolve issues together in real time.
Conclusion
Choosing the best analytics tools for hospitality tech that scale with your portfolio growth is one of the most important operational decisions for advanced analytics in hospitality. Relying on broken manual reporting throttles your growth, while rigid BI tools can slow down your agility.
By prioritizing flexible rollups and a unified view of your operations and finances, you empower your team to make faster and more accurate decisions. Quadratic helps to streamline hospitality analytics by providing a centralized platform to unify data across multiple sources and seamlessly leverage AI for data analysis. Try Quadratic for free.
Frequently asked questions (FAQs)
Why do traditional reporting methods fail hospitality tech as portfolios grow?
Traditional manual spreadsheets and siloed systems quickly become unmanageable when scaling beyond a few locations. This leads to disconnected operational and financial data, making accurate, timely reporting nearly impossible. Operators need top analytics platforms for b2b hospitality tech to unify these disparate data streams.
What should hospitality operators prioritize when evaluating analytics tools?
When seeking the best analytics tools for hospitality tech, operators should prioritize solutions that offer multi-entity reporting and rollups, deep integration with fragmented systems, and the ability to standardize KPIs and perform cohort analysis. These features ensure data consistency and actionable insights across a growing portfolio.
How does Quadratic help unify operational and financial data for hospitality tech?
Quadratic connects directly to live data sources like databases, APIs, and QuickBooks, allowing hospitality tech companies to merge their financial and operational data in a collaborative spreadsheet environment. This enables analysts to build custom multi-location analyses, combining Python, SQL, and spreadsheet formulas for comprehensive insights.