James Amoo, Community Partner
Jun 1, 2026

Table of contents
- Can you use SQL in Google Sheets? The short answer
- How the QUERY function approximates SQL
- Where the QUERY function breaks down
- The hidden cost of formula-based workarounds
- How Quadratic streamlines SQL-in-spreadsheet workflows
- Conclusion: SQL deserves to be first-class in your spreadsheet
- Frequently asked questions (FAQs)
Exploring SQL in Google Sheets means you didn't wake up wanting to learn a spreadsheet function. You have structured data, probably across more than one tab or source, and you need to join, filter, and aggregate it the way you would in a database. Formulas can technically do all of that, but the moment your dataset grows or your logic gets nested, the spreadsheet starts feeling like the wrong tool for the job.
The usual answer the internet hands you is the QUERY function. It looks like SQL, it reads like SQL, and for small problems, it does the job. This article isn't going to walk you through QUERY syntax line by line. Instead, it's going to interrogate whether using SQL in Google Sheets through QUERY is actually enough, and what to do when it isn't.
When you find yourself reaching for SQL inside a spreadsheet, whether you are using SQL in Excel or Google Sheets, that's a signal your analysis has outgrown formulas. Using SQL in Google Sheets via QUERY can buy you some runway, but the workarounds compound quickly, signaling it is time to evaluate new software for data analysis. There's a cleaner path forward, and it starts with treating SQL as a first-class citizen in the spreadsheet rather than a function approximation.
Can you use SQL in Google Sheets? The short answer
Can you use SQL in Google Sheets? Not real SQL. What Google Sheets gives you is the QUERY function, which uses the Google Visualization API Query Language. That language borrows SQL's vocabulary, but it's a SQL-like subset, not a SQL engine.
There's a meaningful difference between writing SQL-style syntax inside a cell and executing SQL against a database. With QUERY, your "SQL" runs against a range of cells. There are no tables, no schemas, no indexes, and no query planner. It's pattern-matching dressed in SQL clothes.
When people ask, "Can I use SQL in Google Sheets?" they usually end up on one of two paths:
- The QUERY function, which keeps everything inside the spreadsheet but limits you to a SQL-ish dialect.
- Third-party connectors or Apps Script, which pipe results from a real database into the sheet, where they then sit as a flat range you query with, well, more formulas.
Quadratic offers a different model. Instead of treating SQL as an external data source that periodically exports results into a spreadsheet, Quadratic supports SQL data analytics directly inside the spreadsheet environment alongside Python, formulas, charts, and AI-assisted analysis. Queries become part of the live workbook rather than an import step that produces a static range. That means data processing, transformation, analysis, and visualization can all happen within the same collaborative workspace.
How the QUERY function approximates SQL
QUERY operates on a range and supports a familiar-looking subset of SQL: SELECT, WHERE, GROUP BY, ORDER BY, LIMIT, and the standard aggregates like SUM, AVG, COUNT, MIN, and MAX. If you've ever needed to run a SQL query in Google Sheets to filter a list of orders or roll up totals by category, QUERY handles it without much ceremony.
The important thing to internalize is what QUERY is not doing. It's about evaluating a string against a rectangular block of cells. There are no tables in the database sense, no joins across schemas, no indexes accelerating lookups. For flat datasets and ad hoc filtering, that's perfectly fine, and it's why how to use SQL in Google Sheets so often boils down to "learn QUERY."
We're not going to turn this into a syntax tutorial. Plenty of references already cover that. The point here is to understand the shape of what QUERY can do so we can talk honestly about where it falls apart.
Where the QUERY function breaks down
This is where most articles on the topic stop. It’s where we're going to start.
Joins are painful or impossible
QUERY has no native JOIN. If you want to do anything resembling a SQL join in Google Sheets, you end up stacking VLOOKUP, INDEX/MATCH, or ARRAYFORMULA against your QUERY output, or feeding a hand-built virtual range into QUERY's data argument using curly braces.
Multi-table analysis becomes a chain of brittle formulas. Want to join transactions to a customer table and then aggregate by customer segment? In real SQL, that's three lines. In Sheets, it's a small architecture project that one wrong sort or inserted column can break.
Scale and performance ceilings
Google Sheets has hard row and cell limits, and you'll feel the soft limits long before you hit the hard ones. QUERY recomputes whenever the underlying range changes. Stack a few QUERY formulas together, layer in some ARRAYFORMULA and IMPORTRANGE calls, and recalculation times start to drag.
There's no indexing. There's no query planner. Performance is a black box, and the only knob you really have is "use a smaller range."
Live data and freshness
QUERY works on whatever is already in the spreadsheet. If your source of truth is a Postgres database, a MySQL instance, a Google Sheets SQL Server connection, or a BigQuery warehouse, QUERY isn't reaching into any of them. You need a connector or an Apps Script job to land the data in a sheet first. The SQL you write never actually touches a live source.
That gap matters. It means your analysis is always operating on a snapshot, and refreshing that snapshot is a separate problem you have to solve and maintain.
Debugging and maintainability
QUERY errors are famously cryptic. "Unable to parse query string" tells you something is wrong, but rarely what. And because the logic is split across formulas and tabs, there's no single source of truth for what the query actually is, often leaving users wishing for an Excel formula explainer to decode the mess. Six months later, when someone else opens the file and asks you to explain Excel spreadsheet logic or Google Sheets formulas, good luck.
The hidden cost of formula-based workarounds
Here's the part that analysts rarely realize: the real cost of using SQL in Google Sheets through QUERY isn't the function itself. It's the surrounding scaffolding.
To mimic a basic JOIN with aggregation across two sources or connect spreadsheets in Excel and Google Sheets, an analyst might end up wiring together QUERY, VLOOKUP, IMPORTRANGE, ARRAYFORMULA, and an Apps Script trigger. Every layer is a failure point. Every layer is tribal knowledge that no teammate can easily inherit. Every layer is one more thing that breaks when a column moves or a sheet is renamed.
The right question isn't "how do I make QUERY do this?" It's "Why am I rebuilding SQL on top of a spreadsheet?"
That reframe matters because the cost compounds quietly. Each workaround feels small in isolation. Together, they create a maintenance burden that eats the time you thought you were saving by staying in Sheets.
How Quadratic streamlines SQL-in-spreadsheet workflows
Quadratic is a spreadsheet built around exactly this idea. You write standard SQL directly in a spreadsheet cell, against live data sources, and the results populate the grid. There's no QUERY approximation, no Apps Script glue layer, no IMPORTRANGE chain. Let’s explore the features of Quadratic in detail.
Connect live databases instead of importing static exports
Many Google Sheets SQL workflows are really export workflows disguised as data analysis using SQL. Someone downloads a CSV from a warehouse, uploads it into Sheets, writes QUERY formulas against the imported range, and repeats the process next week.
Quadratic removes much of that operational overhead through direct connections to live data sources such as Postgres, MySQL, Snowflake, Supabase, and APIs. Queries run against the source itself rather than against manually refreshed spreadsheet copies.
That distinction matters once reporting becomes recurring. A sales data visualization connected directly to transactional data stays current without requiring another CSV handoff. A finance model can pull updated ledger entries from a database while preserving spreadsheet calculations and executive-facing summaries in the same environment.
Use advanced SQL without spreadsheet workarounds
QUERY in Google Sheets was never designed to support the full surface area of analytical SQL. Window functions, common table expressions, subqueries, recursive logic, and multi-stage transformations quickly push the environment beyond what it handles comfortably.
Quadratic supports real SQL syntax directly in spreadsheet cells, which opens up workflows that are difficult or impractical inside Google Sheets alone.
An operations team can use window functions to calculate rolling retention rates. A finance analyst can build multi-step revenue attribution logic using CTEs. A product analytics workflow can combine user event tables with account metadata through proper joins and subqueries rather than maintaining helper tabs across the workbook.
Combine SQL, Python, and spreadsheet formulas in one workflow
One of the biggest structural problems with spreadsheet SQL workflows is fragmentation. SQL lives in one tool, Python transformations live in another, and spreadsheet analysis happens somewhere else entirely.
Quadratic collapses those layers into a single environment. SQL queries, Python code, spreadsheet formulas, charts, and AI-generated analysis all coexist in the same canvas.
That matters for mixed analytical workloads. SQL is excellent for joins and aggregations, but pandas may be better for statistical modeling or data cleaning. Spreadsheet formulas remain useful for lightweight calculations and executive-facing summaries. Quadratic allows each layer to do the work it is best suited for without forcing the user to leave the spreadsheet environment.
A typical workflow might start with a SQL query pulling customer transactions from Postgres, continue with a Python cell performing cohort analysis in pandas, and end with spreadsheet formulas tracking KPIs for a dashboard. The entire pipeline stays visible and connected in one file.
Use AI to generate and explain SQL workflows
A major barrier to spreadsheet SQL adoption is that many spreadsheet-native users understand the business problem but not necessarily the SQL syntax required to solve it cleanly.
Quadratic's built-in AI helps bridge that gap by generating SQL queries directly in the spreadsheet environment. Users can describe the task in natural language and receive executable SQL in a cell tied to the live dataset already in context.
A marketing analyst might ask the AI to identify campaigns with declining conversion efficiency over the last six months. A finance team could request a query comparing regional revenue growth against forecast assumptions. The AI-generated SQL appears directly in the sheet, fully editable and inspectable.
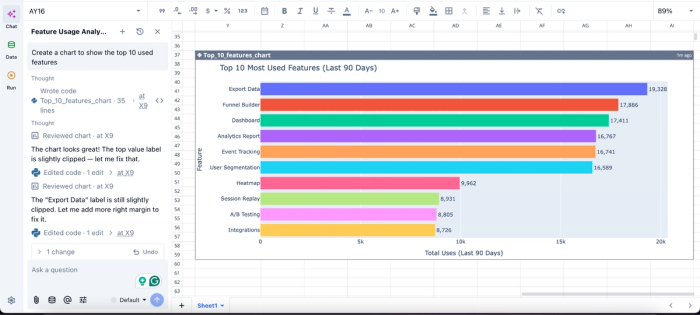
Here’s an example of AI-powered analysis in Quadratic:
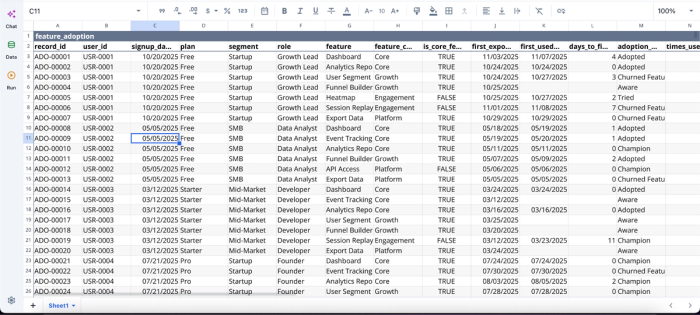
Now that we have our data in Quadratic, we can immediately begin analysis:
In this image, I ask Quadratic AI, “Calculate the average satisfaction score for each adoption stage.” It instantly creates a table that shows the average satisfaction score across all users.
Build charts from live query results
Spreadsheet automation and analysis often break down at the visualization stage. Query results get exported into another platform, and dashboards drift out of sync with the underlying data.
Quadratic keeps visualization attached directly to the live analytical workflow. SQL query outputs populate the grid, and charts reference those results directly inside the same spreadsheet.
A revenue operations team can query sales data, calculate pipeline metrics, and generate charts from the resulting dataset without leaving the workbook. An accounting dashboard can update financial data visualizations automatically as fresh query results arrive from the database connection.
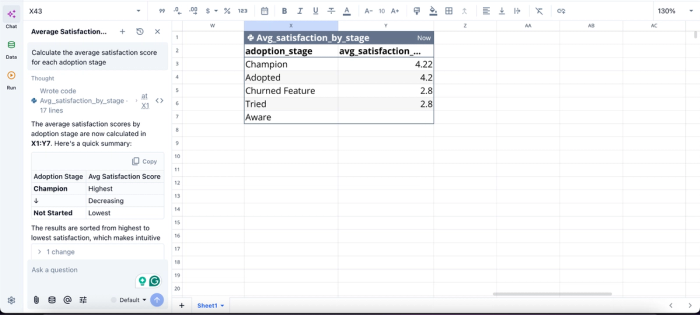
With the use of simple text prompts, users can generate dynamic visualizations in Quadratic right from the spreadsheet:
In this image, I ask Quadratic AI to “Create a chart to show the top 10 used features.” In seconds, it generates an interactive chart that shows the top 10 most used features in the application, based on my dataset, which is essential for tracking feature adoption metrics.
Make spreadsheet analysis collaborative instead of tribal
Many advanced Google Sheets workflows become effectively unmaintainable over time. One analyst understands the QUERY chains, another maintains the Apps Script automation, and everyone else avoids touching the file out of fear of breaking something.
Quadratic improves that situation by making the logic more explicit and collaborative. SQL queries are readable directly in cells. Python transformations sit beside the datasets they modify. Real-time multiplayer collaboration keeps teams working in the same shared environment rather than passing spreadsheet copies through email.
Conclusion: SQL deserves to be first-class in your spreadsheet
QUERY is SQL-ish, not SQL. It's a clever approximation that holds up for basic data exploration and quietly buckles under the kinds of analyses that actually move the business, such as joins across sources and reusable logic that doesn't depend on a specific person remembering how the file is wired together.
The hidden tax of formula workarounds compounds. Every IMPORTRANGE, every nested ARRAYFORMULA, every Apps Script trigger is a small bet that the workaround will keep working. Often it does, until it doesn't, and untangling it costs more than the analysis was worth. That’s the limitation that comes with the SQL in Google Sheets workflow.
You don't have to keep approximating. Quadratic allows you to use SQL directly in the spreadsheet to analyze and transform data without Google Sheets workarounds. Real joins, real connections, real SQL alongside formulas and Python in one environment is a better answer than any new clever way to run a SQL query in Google Sheets. Try Quadratic for free.
Frequently asked questions (FAQs)
How do I run a SQL query in Google Sheets?
The standard approach is the QUERY function, written as =QUERY(range, "SELECT ...", header_rows). It treats your data range as a pseudo-table you can filter and aggregate. While this works for simple, self-contained analyses on a single range, it becomes limiting when you need joins, live database connections, or more complex SQL logic.
Can you do a SQL join in Google Sheets?
Not natively. The QUERY function has no JOIN keyword, so the typical workaround is stacking VLOOKUP, INDEX/MATCH, or ARRAYFORMULA formulas to simulate joins. These approaches get fragile quickly as datasets grow or change, and they scatter your logic across multiple cells and helper columns rather than keeping it in one place.
What should I use if using SQL in Google Sheets becomes too limiting?
If you find yourself chaining formulas to fake joins or maintaining complex IMPORTRANGE and Apps Script scaffolding, a native SQL spreadsheet is a cleaner path forward. Quadratic lets you write standard SQL directly in a cell, connect to live databases and APIs, and combine query results with formulas and Python in the same sheet.