
James Amoo, Community Partner
Apr 30, 2026

For years, investors and analysts have relied on traditional spreadsheet plugins to fetch stock prices and financial statements. While these tools solved the immediate problem of getting numbers onto a grid, the landscape of financial modeling is shifting. If you are searching for a Wisesheets alternative, you likely already know that modern financial data analysis demands intelligent workflows that bridge the gap between pulling numbers and actually understanding them.
The short answer is that platforms like Quadratic represent the next step forward. Quadratic combines spreadsheet familiarity with Python-based computation, AI-assisted analysis, and scalable data handling, making it a stronger alternative for users who need more than basic data retrieval.
In this blog post, we’ll break down where Wisesheets performs well, explore its limitations, and explain why many analysts are moving toward more advanced solutions. You’ll also see how Quadratic addresses these gaps by enabling automated workflows, deeper analysis, and a more cohesive approach to modern financial reporting.
Wisesheets for stock market analysis
Wisesheets is a spreadsheet add-on built for Excel and Google Sheets that allows users to pull financial data directly into their models using simple formulas. It connects to a wide range of financial datasets, including company fundamentals, historical financial statements, stock prices, and key performance metrics. Instead of manually sourcing data from multiple platforms, users can retrieve structured stock data in Excel.
Wisesheets excels in simplifying fundamental analysis for individual investors, analysts, and small teams who prioritize speed and ease of use. It is particularly effective for building quick valuation models and tracking company performance over time. For instance, a user can create a dashboard that monitors key metrics like price-to-earnings ratios or revenue growth across a watchlist.
The limitations of traditional financial add-ons
Legacy spreadsheet plugins often introduce as much friction as they remove. Users frequently run into rate limits and deal with constant compatibility headaches when software updates break their connections.
The core issue is the strict divide between getting market data into a spreadsheet and the manual work required for stock market analysis. Once the data populates, analysts are left building complex formulas from scratch, which can lead to common problems in financial statement analysis. Constantly refreshing these brittle formulas creates major bottlenecks for investors who need fast insights. Professionals actively searching for a Wisesheets or MarketXLS alternative are usually trying to escape these exact workflow limitations, seeking a more seamless way to move from raw numbers to actionable research.
Also, traditional add-ons fall short when it comes to spreadsheet automation and collaboration. Most workflows remain highly manual, requiring users to trigger updates, maintain formulas, and share static files across teams. This not only increases the risk of inconsistencies but also limits real-time collaboration and version control. As a result, teams spend more time maintaining spreadsheets than generating insights, reinforcing the need for more integrated solutions that can handle both automated data processing and advanced analysis in a unified environment.
Wisesheets still excels in providing accessible financial data within a familiar spreadsheet environment. Its simple formula-based approach makes it easy for users to pull standardized financial statements, key metrics, and historical data without any coding knowledge. For individual investors or analysts running lightweight models in an investment portfolio spreadsheet, Wisesheets remains a highly efficient tool that reduces the time spent on manual data collection and allows for rapid analysis.
What to look for in a modern Wisesheets alternative
When upgrading your financial workflow, the primary goal should be unification rather than stacking multiple isolated tools. A modern platform should provide a single environment where data ingestion, analysis, and visualization happen seamlessly. Instead of jumping between spreadsheets, external APIs, and separate analytics tools, analysts should be able to work within one system that supports end-to-end financial modeling and reduces operational friction.
The best tools go beyond basic spreadsheet functions by offering native integration of languages like Python and SQL directly within the analysis environment. This enables users to run advanced calculations, build predictive models, and manipulate large datasets without running into the performance limitations commonly associated with traditional add-ons like Wisesheets. A scalable architecture ensures that as your data grows, your workflows remain stable and reliable.
Automation is another critical factor. Modern platforms should minimize manual intervention by enabling repeatable workflows and streamlined reporting processes. For users specifically searching for a free alternative to Wisesheets, it is also essential to prioritize tools that offer strong built-in data capabilities or flexible free tiers. This reduces dependence on multiple paid subscriptions while still providing access to the data and functionality needed for meaningful financial analysis.
How Quadratic unifies market data and AI analysis
Quadratic represents the next evolution of the spreadsheet for financial professionals, moving far beyond basic add-ons. Instead of extending a traditional spreadsheet with add-ons, Quadratic allows you to move from raw financial data to research insights, technical signals, and portfolio decisions without leaving the same workspace. This makes it particularly effective for investors who want both flexibility and automation in their analysis. Let’s see how Quadratic helps you with stock market analysis.
Build continuously updating stock research reports
Quadratic allows you to pull financial statements and stock market data directly into the grid from multiple live sources. Your stock research report templates update automatically as new earnings or price data becomes available.
This transforms static reports into living documents. Instead of re-downloading data or manually refreshing formulas, your entire research stack stays current and ready for decision-making.
Combine technical analysis with fundamental data in one model
Quadratic enables you to pull historical price data and calculate technical indicators like moving averages or momentum signals alongside financial metrics. Both datasets live in the same grid.
This unified approach allows you to align “what to buy” with “when to buy.” You can validate fundamental strength while simultaneously identifying optimal entry and exit points.
Ask AI to evaluate companies across key financial metrics
You can prompt Quadratic’s AI to analyze revenue growth, margins, valuation multiples, and other performance indicators across a list of companies. It can also help summarize trends and highlight outliers.
This significantly reduces the time required for fundamental vs technical analysis. Rather than building complex formulas, you can generate structured insights instantly and refine them as needed. Let’s see how this works using Quadratic’s technical analysis template:
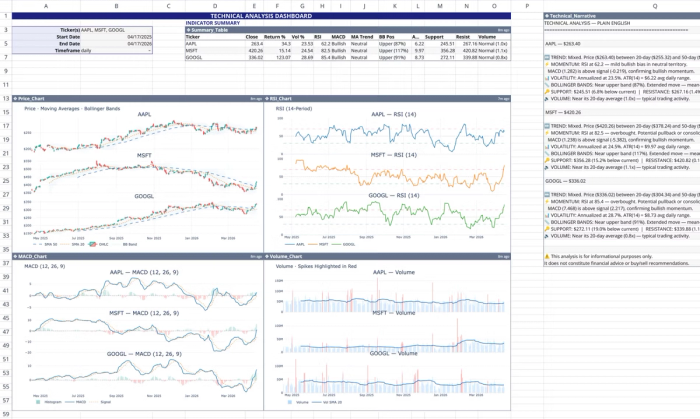
This template automatically pulls real-time and historical stock data using Quadratic's stock market data API to calculate and visualize 12 standard technical indicators. Users simply have to include company tickers, and the data updates accordingly across the dashboard.
We can also perform analysis by simply asking questions:
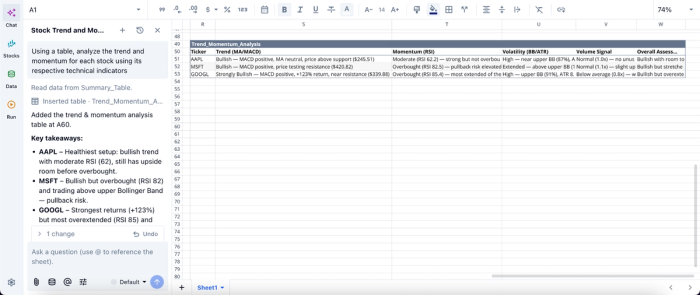
Here, I prompt Quadratic AI, “Using a table, analyze the trend and momentum for each stock using its respective technical indicators.” It instantly generates a table that gives insights into the trend, momentum, volatility, and volume signal for each stock.
Visualize trends and signals with dynamic charts
Quadratic allows you to create charts for price trends, financial performance, and custom indicators directly from your data. These financial data visualizations update automatically as inputs change.
This makes it easier to spot patterns and communicate insights without exporting data to separate tools. Visualization in Quadratic can also be done by using text prompts:
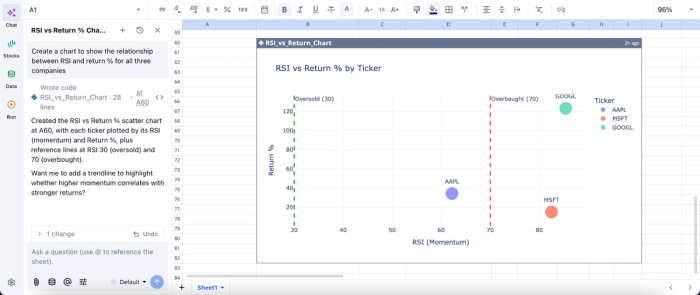
In this image, I ask Quadratic AI to “Create a chart to show the relationship between RSI and return % for all three companies.” In seconds, it creates a visualization based on that prompt. This helps to easily communicate insights to non-technical stakeholders.
Build custom stock screeners with Python and SQL
Instead of relying on predefined filters, Quadratic lets you define your own screening logic using Python, SQL, and spreadsheet formulas. You can screen based on valuation, growth, technical signals, or any hybrid combination.
This flexibility is critical for serious investors. Your screener evolves with your strategy, rather than forcing you into rigid criteria.
Automate your entire stock analysis workflow
Quadratic allows you to schedule tasks and run analyses automatically. Your screeners, models, and dashboards update in the background without manual effort.
This ensures that your insights are always based on the latest data, giving you a consistent edge in fast-moving markets.
Collaborate on research and investment decisions in real time
Quadratic is built for multiplayer collaboration, enabling teams to work on the same analysis simultaneously. Analysts can review models, adjust assumptions, and validate outputs together.
This collaborative analytics platform reduces errors and ensures alignment across research workflows, especially for investment teams.
Wisesheets vs Quadratic for stock market analysis
In this section, we’ll see how Wisesheets and Quadratic compare for stock market analysis, helping you choose the best tool for your workflow.
| Metric | Wisesheets | Quadratic |
|---|---|---|
| Data connectivity | Limited to supported financial datasets within the add-on ecosystem | Connects to multiple APIs, databases, and datasets for a fully integrated workflow |
| Stock research workflow | Primarily focused on pulling financial data into spreadsheets for manual analysis | End-to-end: live data, analysis, visualization, and dashboards in one environment |
| AI-assisted stock analysis | Mostly data retrieval with minimal analytical assistance | AI can compare companies, generate valuation models, summarize insights, and assist with research workflows |
| Financial statement analysis | Provides access to financial data, but analysis must be built manually using spreadsheet formulas | Pull, structure, and analyze income statements, balance sheets, and cash flows with Python/SQL and automation |
| Custom stock screeners | Basic screening via spreadsheet formulas with limited flexibility | Fully customizable screeners using Python, SQL, and formulas with dynamic logic |
| Technical + fundamental integration | Primarily focused on fundamentals, technical analysis requires a separate setup | Combine price data, technical indicators, and fundamentals in one unified model |
| Portfolio tracking | Basic tracking; advanced analytics require manual spreadsheet work | Advanced tracking with automated updates, allocation views, and performance metrics (TWR, MWR) |
Conclusion
Choosing the right Wisesheets alternative comes down to aligning your workflow with the demands of modern financial analysis. If your current setup is slowing you down or limiting your ability to scale, it may be time to transition to a more capable platform. By adopting a solution designed for automation and advanced analytics, you position yourself to extract deeper insights and stay competitive in an increasingly data-driven market.
Platforms like Quadratic embody this shift by bringing data ingestion and visualization into a single workspace. Instead of juggling multiple tools, users can seamlessly pull market data, run advanced analyses using Python, and generate dynamic visualizations. Try Quadratic for free.
Frequently asked questions (FAQs)
Why are investors looking for a Wisesheets alternative?
Investors are seeking a Wisesheets alternative to overcome the limitations of traditional spreadsheet add-ons, which often include rate limits and compatibility issues. They desire a more seamless and intelligent workflow that moves beyond simply importing data to actively understanding market insights.
What are the main drawbacks of traditional financial spreadsheet add-ons?
Traditional financial add-ons often create friction by imposing rate limits and causing compatibility headaches with software updates. These tools also maintain a strict divide between data fetching and the manual analysis needed, leading to significant bottlenecks in the workflow.
How does Quadratic provide a modern Wisesheets alternative for financial analysis?
Quadratic acts as a powerful Wisesheets alternative by offering an AI-powered spreadsheet environment that integrates native Python, SQL, and standard formulas. It features built-in access to stock market data and uses AI to generate Python code for automatically retrieving and analyzing rich datasets like company fundamentals and technical indicators. This approach streamlines analysis and enables repeatable workflows, moving beyond the limitations of piecemeal add-ons.