
James Amoo, Community Partner
May 7, 2026

Table of contents
In the fast-paced world of financial data analysis, having reliable access to market data directly within your spreadsheet is non-negotiable. If you are evaluating stock market analysis tools to bridge the gap between live market feeds and your models, you have likely considered traditional Excel add-ins. This MarketXLS review explores whether standard add-ins still justify their cost or if they fall short of the demands of scalable financial analysis.
While MarketXLS provides quick access to stock quotes and historical data, the evolving needs of analysts highlight a growing need for more AI-enhanced workflows. In this article, we will cover the core features of traditional add-ins, the emerging challenges in financial reporting, and the industry's shift toward programmatic solutions.
Evaluating MarketXLS for financial data fetching
For many spreadsheet users, MarketXLS serves as a straightforward bridge between raw financial markets and their Excel workbooks. Its core functionality revolves around pulling real-time stock quotes, historical pricing data, and options chains directly into spreadsheet cells. The primary selling points are clear: it offers ease of installation, comes with a variety of pre-built templates, and allows users to fetch essential market data without needing to write any code.
When looking through various MarketXLS reviews, users typically evaluate the software along a few common decision axes. Pricing tiers are a major consideration, as the cost must align with the frequency and volume of data retrieval needed. Additionally, the quality of customer support and the overall breadth of data coverage play a significant role in the purchasing decision. For analysts whose primary need is simple data exploration within a familiar Excel environment, the add-in fulfills its core promise effectively.
The limitations of traditional spreadsheet add-ins
As financial models grow in complexity, depending on add-ins from traditional spreadsheets like Excel and Google Sheets introduces inherent risks. Typical financial add-ins function primarily as static data pipes. They are built to deliver numbers into cells, but they fail to support advanced data analytics techniques or custom programmatic logic. When a model requires complex data transformations or iterative testing, a static data feed quickly becomes a limiting factor. This makes analysts explore alternatives to MarketXLS.
Analysts frequently encounter recurring challenges with these traditional setups. The risk of manual errors increases when data must be repeatedly refreshed, copied, or pasted across different tabs. Furthermore, traditional add-ins offer little in the way of collaboration, and they struggle to process unstructured financial data like company news or earnings transcripts. The core bottleneck is the fragmentation of the workflow. Without a unified workspace where raw data and visualizations can interact seamlessly, financial models become fragile and difficult to scale.
Another major limitation is the lack of auditability and version control. As models evolve, tracking changes across multiple spreadsheet versions becomes increasingly difficult, especially in team environments. Small formula adjustments or data inconsistencies can go unnoticed, leading to discrepancies in outputs and reduced trust in the model. Quadratic, a MarketXLS alternative, addresses these challenges by unifying live data, programmable logic, and collaborative analysis in a single workspace, eliminating fragmentation and significantly improving reliability.
The shift toward programmatic and AI-enhanced workflows
To overcome these bottlenecks, modern finance is shifting toward workflows that offer more than just simple data processing, embracing spreadsheet automation to enhance efficiency. Analysts now require environments that can handle sophisticated data manipulation, predictive analytics, and automated reporting. Integrating AI tools for finance transforms a standard Python spreadsheet into a robust analytical engine.
This approach allows for custom queries and highly adaptable logic, making it easier to handle diverse data sources seamlessly. Instead of relying on pre-packaged formulas, analysts can write or generate code to clean, transform, and analyze datasets exactly as needed. Ultimately, this shift highlights the necessity of unified data platforms. When data fetching, complex analysis, and rich visualizations coexist dynamically, teams can build models that are not only powerful but also transparent and easy to audit.
How Quadratic unifies market data and custom logic
A core limitation of traditional add-ins like MarketXLS is that they primarily act as data delivery tools. They bring market data into Excel, but the actual analysis, transformation, and validation often happen across disconnected formulas or external scripts. Quadratic takes a fundamentally different approach by unifying the entire workflow. From pulling raw market data to building valuation models and visualizing outputs, everything happens inside the same grid. Let’s explore the features of Quadratic in detail.
Pull live market, fundamental, and macro data directly into your models
Modern financial analysis requires more than just price data. You need access to financial statements, macroeconomic indicators, and alternative datasets to build a complete picture of any asset. Quadratic supports direct connections to multiple financial data sources and stock market data, allowing you to bring these datasets into your spreadsheet without relying on manual imports or brittle integrations.
This means you can construct workflows that combine price history with revenue growth, margins, or macro signals in real time. Instead of treating each dataset as a separate step, your entire data layer becomes dynamic and continuously updated within a single environment.
Build custom stock screeners with programmable logic
Predefined filters in traditional tools are often too rigid to build nuanced investment dashboards for portfolio tracking. Quadratic allows you to build objective stock screeners using a combination of spreadsheet formulas alongside native Python and SQL logic.
This enables you to define your own ranking systems, combine technical and fundamental analysis, and continuously refine your screening logic. Because the screener is powered by live data, it updates automatically as market conditions change, ensuring your outputs remain relevant.
Analyze price action and technical signals alongside fundamentals
Effective stock research requires blending technical and fundamental perspectives. Quadratic allows you to work with historical price data, calculate technical indicators, and visualize trends directly within the same workspace where your fundamental analysis lives.
This approach eliminates the need to switch between charting tools and spreadsheets. You can evaluate how price momentum aligns with underlying business performance.
Ask AI to analyze stocks across multiple dimensions
Stock analysis often involves comparing companies across a range of metrics, from valuation ratios to growth trends. Quadratic’s AI agents for data analysis allow you to query your dataset directly and generate structured insights without building every formula manually.
For example, you can ask the system to compare revenue growth, profitability, and valuation across a watchlist, or to identify outliers based on specific financial criteria. This shifts the workflow from manual computation to interactive analysis.
Let’s see how this works using the stock research template in Quadratic:
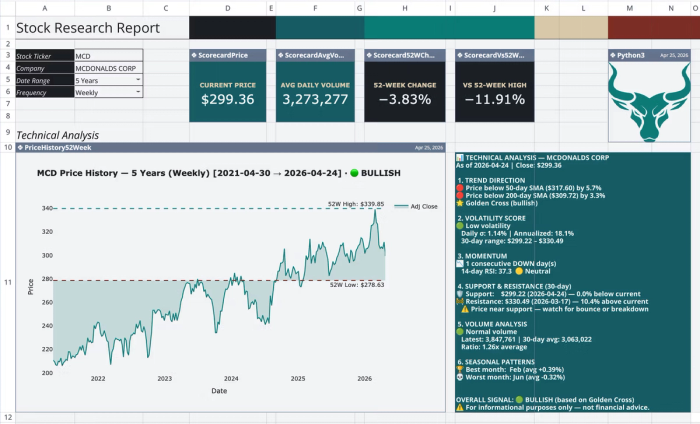
This template provides a single-ticker financial research dashboard for comprehensive financial reporting, organized across four sheets. It automates the retrieval of historical price data and the calculation of technical indicators directly within the spreadsheet. Quadratic allows users to perform custom analysis using text prompts:
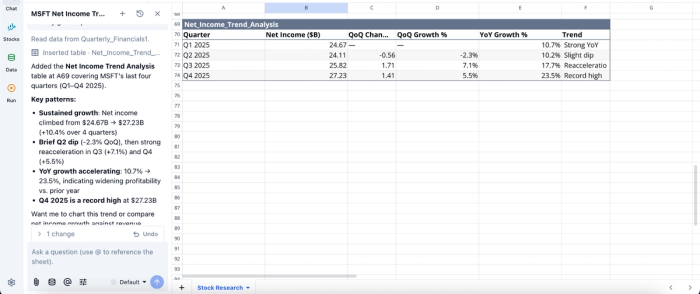
Here, I prompt Quadratic AI, “Using a table, analyze the trend of net income over the last four quarters to identify growth patterns”. It instantly generates a table that displays insights into growth patterns using metrics such as the net income, QoQ change, and YoY growth.
Turn analysis into real-time dashboards
Insights are only valuable if they can be clearly communicated. Quadratic includes built-in data visualization tools that allow you to create charts, performance dashboards, and comparative views directly from your live datasets.
Since these financial data visualizations are tied to continuously updating data, they reflect real-time market conditions without requiring manual refreshes. This makes it easier to monitor portfolios and present findings to stakeholders.
Visualizations in Quadratic can also be done by using text prompts:
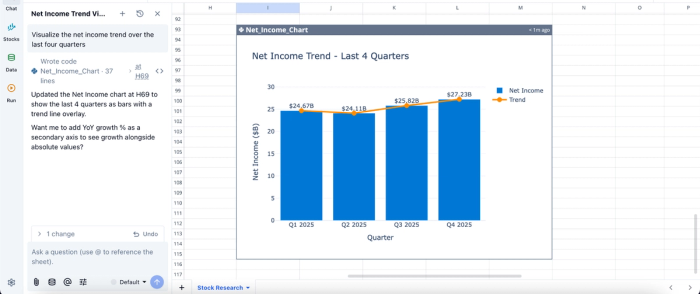
In this image, I ask Quadratic AI to “Visualize the net income trend over the last four quarters.” It instantly creates a net income trend visualization, all from a simple text prompt.
Collaborate on financial models without version conflicts
Financial analysis is rarely a solo activity, especially in team environments. Quadratic’s real-time collaboration allows multiple users to work on the same spreadsheet simultaneously, reviewing logic and validating outputs together.
This eliminates the version control issues common with traditional spreadsheet workflows. Everyone operates on the same live model, ensuring alignment and improving the overall quality of analysis.
Conclusion: Upgrading your financial tech stack
To summarize this MarketXLS review, while traditional add-ins are useful for basic market data retrieval, the demands of modern financial analysis require a much more flexible and scalable environment. Relying on static data pipes limits your ability to build robust models that can adapt to complex analytical needs.
Quadratic provides a unified environment that brings your stock market data, analysis, and visualizations into one collaborative space, allowing you to unlock deeper insights faster. Try Quadratic for free.
Frequently asked questions (FAQs)
What are the primary benefits of MarketXLS, based on this review?
MarketXLS offers straightforward access to real-time stock quotes, historical pricing data, and options chains directly within Excel. Users appreciate its ease of installation, pre-built templates, and the ability to fetch essential market data without needing to write code.
What limitations do traditional spreadsheet add-ins like MarketXLS present for modern finance?
Traditional add-ins primarily function as static data pipes, limiting their ability to support advanced reproducibility or custom programmatic logic. They can increase the risk of manual errors and offer little in the way of collaboration, struggling to process unstructured financial data effectively. This fragmentation of the workflow makes financial models fragile and difficult to scale.
How does Quadratic address the challenges identified in this MarketXLS review?
Quadratic provides an AI-enhanced spreadsheet environment that unifies familiar spreadsheet functions with AI-generated Python code, going beyond basic price histories to pull richer market datasets. This approach ensures data, custom logic, and visualizations coexist in the same grid, making financial models highly reproducible, adaptable, and collaborative. Users can connect directly to various live data sources for seamless analysis.