
James Amoo, Community Partner
Jun 1, 2026

Table of contents
- Why analysts reach for Python in Google Sheets
- The default path: connecting Python to Google Sheets via the API
- The hidden costs of external Python-to-Sheets integrations
- The real problem: Python lives outside the grid
- How Quadratic streamlines the Python-in-spreadsheet workflow
- Conclusion
- Frequently asked questions (FAQs)
If you are exploring the possibility of Python Google Sheets, you are probably already past the limits of formulas. Maybe a VLOOKUP chain has become unreadable, recalcs are crawling, or the same manual data cleaning process is eating your Monday mornings. Python and Google Sheets feel like the obvious next step. It allows you to connect a script, push results back, and move on. But the way most tutorials suggest combining Python and Google Sheets quietly creates a new problem, swapping formula pain for pipeline pain.
This article makes the case that the issue is architectural, not syntactic, and that a spreadsheet with native Python is a better answer than bolting Python onto Google Sheets from the outside.
Why analysts reach for Python in Google Sheets
The trigger is usually familiar. A sheet that worked fine at 5,000 rows starts choking at 50,000. A nested IF/INDEX/MATCH formula becomes impossible to debug. You need a real join or a statistical test that does not exist as a function. Or you find yourself manually refreshing the same financial report every week and want it to just run.
At that point, formulas have usually reached their practical limits. Large datasets create recalculation bottlenecks, and ranges begin standing in for data structures they were never designed to represent. Repeating the same data processing, transformation, and reporting steps every week also exposes how awkward spreadsheet-only automation can be. What starts as a convenient grid gradually turns into a collection of manual processes that consume more time than the analysis itself.
Python is the natural next tool. It has pandas for tabular data, a deep statistics and predictive analytics ecosystem, and clean ways to express logic that formulas mangle. The real question is not whether to use Python and Google Sheets together. It is how. Plug Python in from the outside, or work in an environment where Python lives inside the grid?
The default path: connecting Python to Google Sheets via the API
The default answer most people encounter is the Python Google Sheets API workflow. At a conceptual level, the process is straightforward. It allows you to create a Google Cloud project, enable the Sheets API, generate a service account, download a credentials JSON file, share the spreadsheet with the service account, install a library such as gspread, and write Python code that reads from or writes to the sheet.
What gspread and the Google Sheets API in Python actually provide is a bridge between a spreadsheet and an external Python process. You gain the ability to read and write ranges, create tabs, update values, schedule recurring jobs, and automate workflows that would otherwise be manual. For developers who are comfortable with authentication flows and Python environments, the Google Sheets Python is flexible and capable. It turns a spreadsheet into an endpoint that can participate in broader data pipelines and reporting systems.
What tutorials often gloss over is the operational overhead that comes with this architecture. Credential management becomes a permanent responsibility because service account keys must be stored securely and shared across environments. The Python runtime itself becomes another system that has to be hosted and maintained. Most importantly, the spreadsheet and the analysis now live in separate places, connected by code that someone has to own. None of these requirements is particularly difficult in isolation, but they accumulate over time.
Quadratic takes a different approach by bringing Python and SQL directly into the spreadsheet environment itself. Instead of maintaining a separate API integration layer, users can work with Python, pandas, SQL, formulas, visualizations, and AI-assisted analysis in a native coding spreadsheet, reducing the amount of infrastructure required to keep spreadsheets and code synchronized.
The hidden costs of external Python-to-Sheets integrations
This is where the Python Google Sheet API story gets interesting, because the costs that matter most are the ones that do not show up on day one.
Pipelines silently break when the sheet structure changes. Someone renames a tab, inserts a column, or edits a header to make it look nicer. The script that depended on "Sheet1!A:F" or a header named "Revenue" now writes to the wrong place or fails outright. The break is often quiet. The script runs, no one notices, and the numbers in the sheet drift from reality.
Auth fails in surprising ways. Service account tokens expire. Someone rotates credentials. A shared drive permission gets tightened during a security review. A sheet gets moved into a folder that the service account cannot reach. Each of these is a different failure mode, and each one leaves the report blank on a Monday morning.
Rate limits and quotas show up at scale. The Google Sheet API Python has per-minute and per-user quotas. A script that worked fine for one analyst hits 429 errors when three teammates run it at once or when the data volume grows.
Ownership decays. The original author of the integration leaves, changes teams, or just forgets. The credentials JSON is on someone's laptop. The cron job runs on a server no one logs into. The notebook that produced the analysis lives in a Drive folder that has not been opened in months.
Versions drift. The real analysis is in a notebook. The numbers people actually look at are in a sheet. When they disagree, no one is sure which is correct, and reconciling them is its own project.
None of this is a critique of gspread or the Google Sheets Python API itself. They do exactly what they are designed to do. The point is that Python Google Sheets pipelines built this way carry a maintenance tax that compounds, and the tax is invisible until something breaks.
The real problem: Python lives outside the grid
Step back from the implementation details, and the structural issue becomes clear. The friction is not Python versus formulas. It is Python-attached-to-a-spreadsheet versus Python-inside-a-spreadsheet.
A two-tool architecture forces context switching by design. The notebook holds the code. The sheet holds the data. A sync layer, whether gspread, Apps Script, or a custom job, sits between them. Every round trip across that boundary is a place where the state can drift, credentials can fail, structure can change, or the canonical version of the analysis can be lost.
This is not a fringe observation. Microsoft's announcement of Python in Excel was, in effect, a recognition that native Python in the grid is a real model, not a workaround. The center of gravity is moving toward a spreadsheet automation environment where Python is built in rather than bolted on.
How Quadratic streamlines the Python-in-spreadsheet workflow
For analysts evaluating a Google Sheets alternative that supports native Python, Quadratic is a concrete example of this native model. Python runs directly in spreadsheet cells, alongside formulas and SQL, in the same browser-based grid. There is no service account, no gspread, no external sync layer to maintain. Let’s explore the capabilities of Quadratic in detail.
Connect live data sources without building export pipelines
One of the biggest weaknesses of external Python-to-spreadsheet setups is the dependency on manual exports and scheduled sync scripts. Teams often spend more time maintaining pipelines than analyzing the data itself. CSV files move through shared folders, teams constantly convert Google Sheets to Excel, APIs push into temporary scripts, and spreadsheets become stale snapshots rather than living operational tools.
Quadratic eliminates much of that friction by supporting direct connections to databases, APIs, and cloud services inside the spreadsheet environment. Data from Postgres, MySQL, Snowflake, Supabase, analytics tools, or internal APIs can flow directly into the grid without intermediary export steps, similar to a Google Sheets SQL Server connection.
That matters for recurring reporting workflows. A revenue dashboard connected to a production database updates against current data rather than relying on yesterday's manually exported spreadsheet. A customer operations model can combine API data, spreadsheet assumptions, and Python transformations in one file without requiring an external orchestration layer.
Write Python directly inside the spreadsheet, not around it
Most Python Google Sheets workflows are layered on top of the spreadsheet rather than embedded within it. The Python script lives in a notebook while the spreadsheet becomes a passive output target. The data in the sheet drifts from the code that produced it, teammates lose visibility into transformations, and debugging turns into a hunt across multiple tools.
Quadratic approaches the problem differently. Python runs natively inside spreadsheet cells, so the grid remains the primary workspace instead of becoming a delivery endpoint. A Google Sheets pandas dataframe returned from a Python cell spills directly into the spreadsheet as a live table that formulas, charts, and neighboring cells can reference immediately. The transformation logic, the source data, and the outputs stay connected in one environment.
That changes everyday spreadsheet workflows substantially. A marketing analyst cleaning campaign exports can write pandas directly against the sheet instead of exporting CSVs into a notebook. A finance team performing financial data analytics can merge, aggregate, and reshape datasets inside the same workbook where the final dashboard lives. The spreadsheet stops being the last mile of the workflow and becomes the execution layer itself.
Combine formulas, SQL, and Python in one model
Most spreadsheet tools force an either-or decision between spreadsheet formulas and programming workflows. Quadratic treats them as complementary layers instead.
Spreadsheet formulas remain useful for lightweight calculations, references, and business logic. SQL data analytics handles structured querying against databases or sheet data. Python handles AI data modeling, statistical analysis, reshaping, and automation-heavy tasks. All three coexist on the same canvas.
That hybrid model is particularly effective for teams transitioning gradually from spreadsheet-only workflows into more code-driven analysis. Analysts do not need to abandon the grid they already understand in order to gain access to modern data tooling, such as running SQL in Google Sheets. They can incrementally introduce Python or SQL exactly where the complexity justifies it.
A forecasting model might use SQL to pull historical transactions, pandas to calculate rolling projections, and formulas to handle final reporting assumptions and track KPIs. The entire pipeline remains visible in the spreadsheet.
Turn natural language into a working analysis
Traditional Python spreadsheet workflows assume the user already knows how to write the code. That creates a steep adoption curve for spreadsheet-native teams that understand the business problem but not necessarily the implementation details.
Quadratic's built-in AI agents for data analysis narrow that gap by generating formulas, Python, SQL, summaries, and transformations directly in the spreadsheet itself. Instead of searching Stack Overflow for a pandas syntax pattern, a user can describe the task in plain language and receive executable code in a cell.
A sales operations manager might ask the AI to identify customers with declining purchase frequency over the last three quarters. A finance analyst could request a rolling forecast model with seasonality adjustments. The generated logic appears directly in the sheet, fully editable and inspectable rather than hidden behind a chatbot response. Let’s see an example.
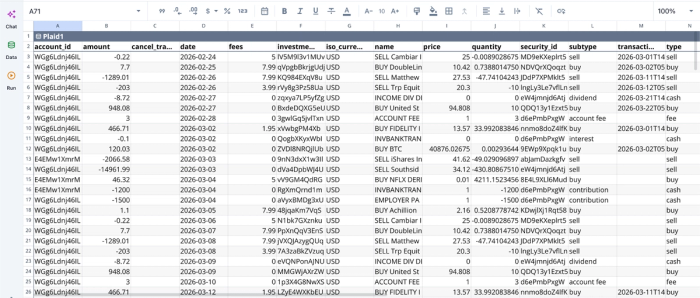
First, I connect to my financial dataset using Quadratic’s Plaid integration:
After successfully connecting to my data, I can immediately begin analysis:
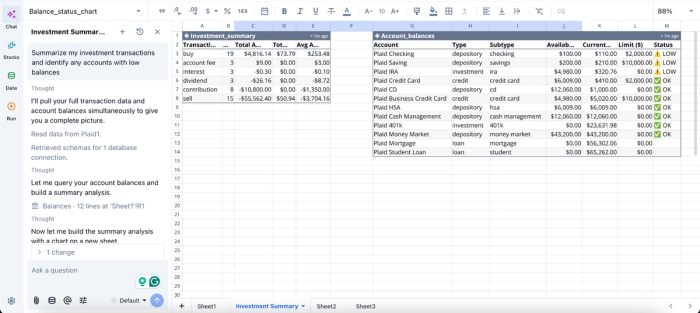
In this image, I ask Quadratic to “Summarize my investment transactions and identify any accounts with low balances.” It instantly creates two tables: one that shows a summary of my investment, and another that gives insights into my accounts with low balances.
Build charts from live Python outputs
Visualization is where many spreadsheet-plus-Python workflows break apart. Data gets transformed in one tool, exported into another, and charted somewhere else entirely. The process becomes fragile quickly, especially once recurring updates enter the picture.
Quadratic keeps data analysis and visualization in the same environment as the underlying data and code. Charts reference live spreadsheet ranges and Python outputs directly, so updates propagate automatically through the workflow.
A product analytics team can connect event data, aggregate it with pandas, calculate retention metrics in Python, and generate cohort analysis in the same workbook. A financial planning team can build scenario models in Python and visualize forecast ranges beside the assumptions driving them.
Visualization in Quadratic can also be done using text prompts. Here’s an example:
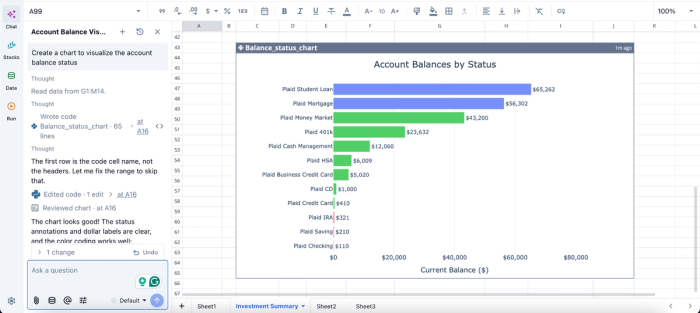
In this image, I ask Quadratic to “Create a chart to visualize the account balance status.” In seconds, it creates a chart that shows the account balance by status.
Collaborate on analysis instead of passing files around
External Python workflows tend to fragment collaboration. One person owns the notebook, another owns the spreadsheet, and everyone else receives exports through email or Slack. Version control becomes informal and error-prone.
Quadratic keeps collaboration inside the same browser-based environment. Multiple people can work in the spreadsheet simultaneously while seeing the same data, Python cells, formulas, and visualizations in real time.
That changes how technical and citizen developers interact around data. Engineers can help optimize a transformation while business stakeholders review the live outputs immediately. Analysts no longer need to translate notebook work into separate presentation artifacts just to share results internally.
Conclusion
The question worth asking is whether Python Google Sheets workflows should be bolted on or built in. External API integrations work, and for genuine one-offs, they are fine. For ongoing analytical work, the round-trip between a notebook and a sheet is where the real cost lives, in broken pipelines, drifted versions, expired credentials, and ownership that quietly disappears.
A spreadsheet with native Python removes the round-trip entirely. The data and the result share one surface, with one audit trail and one place to come back to. Quadratic allows you to use Try Python directly in a spreadsheet-native workflow instead of forcing code into Google Sheets. Try Quadratic for free.
Frequently asked questions (FAQs)
What is the difference between using the Google Sheets API with Python and native Python in a spreadsheet?
The Google Sheets API with Python (via gspread or the official client) requires you to authenticate through a service account, host an external Python runtime, and manage credentials. Native Python in a spreadsheet eliminates this boundary; Python runs directly in cells alongside your data, with no authentication setup, no external sync layer, and no maintenance overhead for credentials or schedulers.
How does Quadratic solve the problems with external Python Google Sheets integrations?
Quadratic runs Python natively in the spreadsheet grid, eliminating the architectural problems that make external integrations painful. You write Python directly in cells, reference ranges by name, and have results flow back into the grid. Pandas, NumPy, and the full Python ecosystem are available in-cell, and versioning, sharing, and access controls follow the spreadsheet itself, keeping your data, logic, and outputs in one auditable place.
What should I do if my spreadsheet work has outgrown both formulas and native Python?
If you have production pipelines that other systems depend on, multi-user transactional systems, datasets too large for any spreadsheet engine, or strictly governed BI requirements, you have likely outgrown spreadsheets as a category. At that point, the right move is a data warehouse or governed BI tool.